- From an annihilation event LOR's are generated. As seen the above example where there are three
- When a coincident event is recorded the LOR defines the path to which it occurred, however, there is one minor problem. The specific location of the event within three dimensional space cannot be plotted, only a line in which the 2 gammas traveled can be drawn
- Therefore, in actuality, each LOR presence a true count in a PET image and an image with significant density has MANY LORs or counts
- Let us take a closer look at how the coordinates of a sinogram
are determined
- As previously stated, the specific location of the event cannot be determined
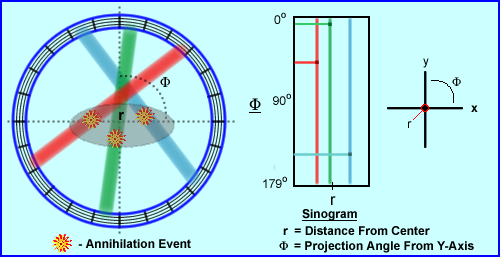
- What can be defined is distance from the center (r) and at what angle
from the the center (M)
- Hence the LOR's location is displayed as (r,M) this does have similarities to (x,y) axis on a 2D graph
- LOR's are projected on to 2-D histograms which come from 3-D volume
- Now refer to the three colored LORs, above, which define three different coincident events
- Color is used to help you associate where the event occurred and were its location is on the sinogram
- In the y-axis, M, the angle of the event occurs between 0 to 179 degrees
- In the x-axis, r, how far from center did the event occur
-
Now let us determine the location of the three LORs, above, and plot the r and M coordinates
- The red LOR is left of center at about 45 degrees
- The green LOR almost goes through the center and has about a 5 degree angle
- The blue LOR is right of center and has about a 140 degree angle
- Sinograms are used to QC the PET system which is done on a daily bases. Using a uniform radioactive PET source 68Ge, data is collected, sinograms are generated. This is referred to as a Blank Scan and it tells us if there is system uniformity. Question - Are all the detectors collecting coincidence in a uniform manner? How does a sinogram tell us this?
- Each block of crystal generates a sinogram. In the example given we are looking at Block 21 with 9
- In addition the extreme angles of coincidence can be and evaluated: 1 through 12 and 13 through 24
- System uniformity is checked with every block and angle
- From the example given, the lack of density (or LORs) within the sinogram indicates failure of specific blocks within certain rays
- When this happens the service dude must be called and the faulty block(s) must be replaced
- PET Imaging Parameters
- What is the difference between SPECT and PET projections/rays?
- A single SPECT projection shows information at that angle across all slices in a 3-D volume (image)
- PET's sinogram slice presences data acquired from a slice across all angles within a given 3-D volume (image)
- Modes of imaging
- Static
- Displays activity located in tissue at specific time
- Temporal resolution is not a factor when thinking static
- One frame of data represents a set of sinograms during a given acquisition
- Consider how FDG locks into issue
- Estimation of radiopharmaceutical uptake can be quantified (SUV)
- Spatial resolution is usually very important
- Dynamic
- Notes the change of activity within the issue over time
- Temporal resolution becomes more important than spatial
- There is a series of frames, of which each one has a set of sinograms
- Consider 15O distribution in a brain scan that is being analyzed over time
- Evaluates radiopharmaceutical distribution over time i.e. analyzing brain function
- Gating
- Can be added to the dynamic process
- Which, just like general nuclear medicine, looks at cardiac contraction
- The best format for this is in a list mode that allowing the user to select the specific R to R waves, which improves temporal resolution
- Whole body format
- The scanner takes multiple axial acquisitions which is reformatted into a whole body projection
- In the example given the axial's FOV is 30 centimeter
- When enough counts are acquired the table moves the patient to the next position
- In the a case above the patient is approximately 68 inches long and 5 axial scans are acquired
- The FOV losses sensitivity as in collects data in the peripheral direction, therefore each image within the acquisition overlaps each other by 3 to 5 cm
- Each image takes between 5 to 10 minutes to acquire, pending the amount of activity administered
- The Collimated Approach - 2-Dimensional
- When thinking about how collimation can help improve PET acquisition it role should be to place lead or tungsten between the rings within the gantry
- Consider the lead/tungsten material as a type of septa
- These septa are approximately 1 mm thick and 7 to 10 cm in length
- They can either be fixed or retractable pending system design
- One role of septa between the rings is to prevent scintillation events from crossing over into adjacent blocks
- Secondly septa can be extended beyond the surface of the crystal
- In diagram A the concept of a direct plane event occurs, where C represents a cross plane event
- Adjacent rings also have coincident circuitry in order to account for a cross plane event. Usually this feature covers plus/minus 5 rings
- In 2D imaging this type of acquisition improves system resolution and reduces system sensitivity by decreasing scatter
- A disadvantage to this setup relates to B in the diagram where a true coincidence occurs, but the septa prevent detection of the event
- The Non-Collimated Approach - 3-Dimensional
- Imaging septa do not play their "extended" role, therefore gamma rays can come in from any angle, be detected, true counts, or scatter
- This type of imaging will improve system sensitivity, however, it will reduce resolution because it significantly increases scatter counts
- The advantage of having the extended septa reduces scatter by 10 to 15 percent
- According to the literature 3D imaging will contain 30 to 40 percent scatter
- How are scatter and random events recorded as coincident events?
- Review of the diagram shows how a scatter event can be recorded. From the initial annihilation the lower left gamma travels in its true direction and is recorded. However, the opposing gamma ray is defected changing its trajectory and then detected. Drawing the 180 degree LOR places the event in an incorrect location
- In a random event the diagram shows two different annihilation events that occur in different areas of the body. In the first annihilation event the first gamma is recorded while the apposing one leaves the system (as indicated by the arrow). The same thing happens to the second annihilation event, one gamma is recorded and the other exits the detector ring. Because both recorded events arrive at the same the LOR is records incorrectly
- One other point to remember is that for any given scatter or random event, both sets of gammas must fall within the set timing window, not necessary at the same time. The longer the timing window the greater the amount of scatter and randomness
- Other factors that affect acquisition
- Normalization
- What causes non-uniformity? The crystal structure itself has some non-uniformity associated with it. In addition there are some 10k elements attached to several hundred PMTs or of which operate "independently." For this reason non-uniformity within an axial acquisition occurs and must be corrected! To generated a correction map for a PET scanner, normalization must be accomplished
- To accomplish this a uniform 68Ge source is used by placing it at the center of a PET's FOV. Data is then collected in 2D and/or 3D format and normalization factors are calculated
- A normalization scan is acquired with 68Ge for 6 hours. Counts of all possible LOR (Ai) are summed and divided to determine the average counts per LOR referred to as the Amean
- Then for every LOR a ratio (difference) can be calculated, and Fi is calculated
- The the actual counts, Ci,are then multiplied by Fi to determine the normalized counts for each LOR. This is referred to as Cnomri
- Can you relate this to SPECT uniformity correction maps?
- Why must you collect 6 hours worth of counts to determine normalization?
- This process must be done at least once a month and maybe recommended weekly. Refer to manufacturer's recommendation
- Photon Attenuation
- In an ideal environment the body habitus would have uniform density. If this were the case then attenuation of the 511 keV gammas would be nothing more than a mathematical calculation to determine LOR attenuation
- However, as you well know, this is not the case, pending the area that is undergoing acquisition
- Therefore, attenuation (:) is independent of the gamma-ray's origin, but completely dependent within the internal structures of the body habitus
- When density is uniform, then the following formula can be used:
- Where P is the probability of detecting coincidence based on the attenuation
- The formula presences two different tissues with two different : values, :a and :b. Since both a and b have the same density the probability of coincidence replaced with :D
- An example of where this could applied would be a brain scan
- Applications of attenuation correction with non-uniformity
becomes significantly more difficult since there are multiple density changes that occur internally. In addition, the specific location of altering density are unknown. A formula representing this type attenuation:
- Here, P, is the probability of detecting of coincidence changes in different parts of the body where variations in density is noted (example - chest/abdomen)
- In this case the formula shows the number of organs (n) with variations of linear attenuation and thickness (:iDi)
- To apply the above formula and mathematically determine what the different attenuation factors would be an is a feet of impossibility
- For this reason the best way to accomplish attenuation correction would with an external transmission source, which could be done with a rod source or CT
- Over time CT has become the method of choice to determine attenuation coefficients. If fact, not only is it faster, but it also gives us the ability to use to fuse anatomical and physiological detail
-
- Application of CT for attenuation
- Daily QC is done to the CT unit where linear attenuation is determined by scanning air. This is refereed to as "cutting the air"
- In PET a daily Blank scan is collected with a uniform source to confirm system uniformity with all LORs
- Next a transmission scan is done on in the area of interest, specifically with the patient
- This is followed by the PET acquisition
- Then a ratio (relationship) is established between the LORs and CT linear attenuation value :
- If linear attenuation shows a drop from increased density then the LORs will have counts added
- Alternatively, if there is a increase in attenuation, then counts are removed from the related LORs
- Additional comments on PET/CT attenuation correction
- Misalignment can be a problem. As an example 2 cm variation may cause up to a 30% variation with the accumulated activity (disease/organ structure). For this reason usually the CT is completed after the PET which may reduce the amount of patient movement and variation
- Segmentation can be applied, which is where known : values are compared to acquired CT : values. Where similarities are noted, the CT : is then replaced with the established, "segmented" :. These known : values would include, but not limited to: bone, lung and soft tissues
- Scaling is process that has to occur when CT attenuation is applied. CT x-rays vary in keV output, however, are much lower than 511 keV gamma. Specifically these lower x-rays interact with the environment differently to their gamma counter part. Why? Because x-ray energy is so much lower the PET gamma. Therefore, the x-ray must be scaled up to 511 keV gamma-ray to assure proper correct translation of the final attenuation map
- Breathing in PET imaging causes distortion in the base of the lung. In CT, the patient should hold his/her breath which may reduce the the amount of distortion with its attenuation correction is applied
- Contrast and metal implants cause excess in CT attenuation that can elevate activity into the false positive range
- More on this in another lecture
- Random coincidence
- The technologist can increase the level of random coincidence in a PET scan by: opening up the % window, extending the timing window, and/or increase the activity administered to the patient
- In turn, increased randomness may induce artifacts by reduce image contrast
- Furthermore sodium iodine detectors and 3-D imaging can increase the level of randomness
- The rate of randomness can be determined with the formula above where J is time in nanoseconds and C1/C2 are the count rates for each detector in the coincident circuit. The represents counts per second
- The difference between true and random
counts
- Random events increase with the square of the dose administered
- True events increase linearly with the administered dose
- Two methods to reduce random gammas
- The simple approach is to reduce your timing window
- The second approach is seen in above
- Using LSO as an example, set two timing windows, on at 6ns and the other at 54ns
- The 6ns window (which is the routine setting ) has both random and true counts
- The 54 ns window only has random counts
- If you generate a ratio between the 54ns and 6ns, those counts represent just random counts
- By subtracting the random counts from the true + random, true counts can be defined
- Scatter counts recorded as coincidence
- In routine nuclear medicine when scatter occurs it can, for the most part, be removed. By setting the LLD and ULD, only the peak is displayed/recorded while the compton region is removed
- In PET, when Compton occurs, these highly energized gammas may not loss enough energy to separate them from true counts when applying the % window. This means that a certain amount of scatter counts will be recorded and accepted into the true count region
- Just like random events, scatter increases BKG, educes contrast, and degrading image quality
- In general the following creates scatter within the PET system
- Increased patient density
- Annihilation events that occur deep within body
- Increasing the % window
- Increasing the administered dose increases scatter linearly
- Remember scatter is detected because deflected and non-deflected gammas arrive at the same time, and become accepted LORs
- So how can you reduce scatter?
- Adjusting the PHA - reduce the % window
- Imaging in 2-D, instead of 3-D
- To remove scatter it has been suggested that you acquired count data outside FOV, subtract them from counts from the "true counts" inside the FOV. The problem with this approach is the assumption that scatter is uniform throughout the FOV
- Dead Time
(J)
- This issue happens with any scintillating device. Remember that dead time is the shortest time it takes to absorb, scintillate, amplify, discriminate, and recording a gamma ray. And in PET, we must add the coincidence of two events occurring in the same timeframe
- Dead time loss occurs when a second coincident event occurs at the same location, therefore missing detection
- To reduce this problem, faster electronics and shorter crystal decay times have been developed
- Pulse pile up can occur when
- A PET system can detect 2 gammas (in a coincident fashion) however, it is seen as 1.022 MeV, causing the PHA to rejected the pulse
- In another scenario, 2 scatter gammas can be detected by coincidence and have the sum total that falls within the PHA window, hence generating an incorrect LOR.
- Pulse pile up occurs when excessive levels of activity are administered to the patient. The end result is image distortion
- Dead time loss can be reduced with the application of buffers within the electronics, pulse pileup rejection circuits , and faster electronics
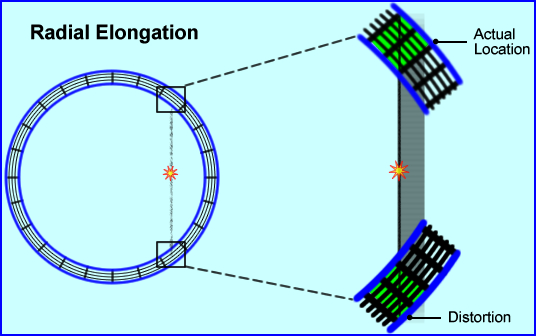
- Radial Elongation
(parallax error/radial astigmatism)
- As the words imply distortion occurs via the elongation of actual data
- This becomes more prevalent in the peripheral regions of the FOV
- From the above diagram, a coincident event is recorded at the edge of the detector block or element where the gamma rays arrive on a tangent to the crystal
- The distance between the actual location and its distortion causes "blurring" of the image by essentially elongating the data. As noted, 2 blocks are involved in this detection, where essentially there should be just one
- This elongation effect increases when
- The FOV is smaller
- When it occurs further away from the center
- In PET systems that have thicker crystals
Return to the Beginning of the Document
Next Lecture - Time of Flight
Return to the Table of Content