PET/CT Attenuation Artifact
Today we are going to evaluate PET images that have been corrected with CT attenuation. The premise of this lecture is to identify how attenuation correction (from CT) can generating artifacts in a corrected PET scan. These artifacts may lead to a false positive diagnosis in which it has been demonstrated CT attenuation + PET in the presences of metal, motion, contrast, and truncation may falsely alter PET data.
Remember a concept that you learned in nuclear cardiology? Always look at the raw data! Sometimes you'll catch an artifact that has the potential of altering the SPECT images. This concept must also be applied to PET images corrected with CT attenuation. Doing so may prevented a false positive diagnosis.
- Application of CT Attenuation with PET images
- We will discuss one of several methods used to correct attenuation densities in a PET scan. PE Kinahan and his associates discuss the development and application of CT attenuation and its role with in PET
- What is scaling and why does it need to be applied in CT attenuation?
- 511 keV gammas for PET interact differently than its CT counterpart (70 - 140 kVp)
- Reason - First there is greater attenuation with lower energy x-ray. In this energy range, when compared to PET gammas, there is greater photoelectric and Compton interaction. On the other hand because of PET gamma rays have a significantly higher energy there is less Photoelectric and Compton interaction.
- When comparing PET to CT the probability of x-rays interacting with air, water, and soft tissue is approximately 1.9. Furthermore, Photoelectric effect increases by 13% when CT x-rays encounter bone, while PET gamma rays increase by just 3%.
- Why do x-rays and gamma ray interactions increase in the Photoelectric range when encountering bone? (1) the presence of calcium and phosphorous in the bone and (2) these elements have higher Z values when compared to the surrounding media
- Therefore, it is important to scale CT x-ray for proper correlation of attenuation in the 511 keV range
- Monochromatic gamma vs. polychromatic x-ray
- PET gamma rays always have the exact same energy, 511 keV
- CT x-rays vary in their energy beam, even when it is set at a specific energy level. Usually there is at least a 1% variation within any given setting. This fluctuation causes a slight variation within any given attenuation coefficient
- Segmentation
- This is a process in which attenuated CT values are converted to known : values of specific tissues found in the body
- Given a certain threshold with the CT x-ray the specific tissue type is identified
- In general, there is a choice between: bone, soft tissue, and lung
- One minor problem with this approach occur when certain types of tissue have variation in density
- As an example consider the lungs. Within the thorax you will encounter soft tissue (heart), lung (has air), and ribs (bone)
- Once the different tissue types are identified Scaling and Segmentation are applied
- Segmentation defines the specific organ or tissue type and applies the correct attenuation
- Scaling (ratios) for bone, soft tissue, and air will further adjusts the attenuation map to the 511keV gamma
- General application of attenuated maps in PET
- Increased density translates to higher CT attenuation coefficients which in turn will increase the amount of counts in the same region of the corrected PET images
- Decreased density translates to lower CT attenuation coefficients that will reduce the amount of counts in the corrected PET image
- It is very important that co-registration of CT and PET occur for appropriate pixel to pixel alignment
- Matrix size must be adjusted. Remember CT has 512 x 512 and PET has 1258 x 128
- Artifacts occur when there is a density mismatch
- Remember to always look at your raw data: CT and PET
- Metal and implants located in the body habitus
- Many types of implants are made of a metallic substances which have high attenuation coefficient (even higher than bone). Other than implants, metal plate, ports, or some other form of associated hardware can high Z material
- Because high density relates to increased attenuation several things happen
- From a CT standpoint usually streaking artifacts are seen. This is especially true with metal objects. Seeing a sticking artifact on CT should immediately clue you to the fact that false alteration of CT attenuation
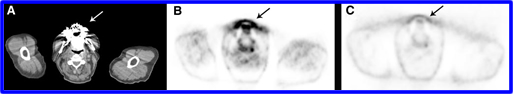
- The problem is that high attenuation coefficient translate to high HU numbers. This correction factor cause the PET images to be overly corrected, falsely elevating the counts within PET scan. In turn, this leads to false positive study because the increased activity indicates disease. To further delineate disease from no disease, the uncorrected PET images must be evaluated. The example above (A) shows the CT image with the streaking artifact [indicating metal], (B) the corrected PET images show abnormal uptake of FDG (could this be disease?), and (C) shows the raw data containing normal FDG distribution
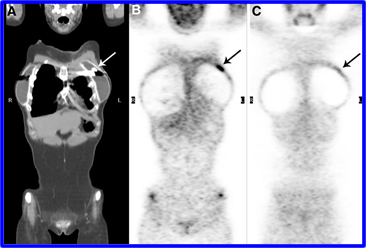
- In the next case, the issue at hand for the technologist is to always make the patient remove all of his/her metal. This includes body piercing and associated metal rings! The above patient has a ring attached to her nipple. CT (A) image shows the streaking artifact, (B) is the corrected PET image, and (C) is the uncorrected PET image. Looking at the raw data saves the patient from visiting her friendly oncologist
- In a slightly different metallic situation what happens when CT and PET both have high attenuation? Such is the case with a hip implant. PET raw data (A) shows a cold area where the prostheses is located. Lack of activity is due to excess attenuation of the 511 keV gammas. Likewise, (B) the corrected PET image also shows a lack of activity. Why does this happen? Shouldn't the highly attenuated CT images cause an increase in the PET counts? But it doesn't .. can you explain why?
- Motion artifacts
- Preventing the breathing artifact in CT
- When a CT scan includes imaging the chest several points must be considered to reduce the motion artifact
- Usually a holding breath image is taken when the scanner acquires data over the chest.
- However, when PET is acquired alternative forms of the CT holding breath image may be considered
- A patient may be asked to take a deep breath and hold it
- Or take a mid-breath and hold it
- Or take shallow breaths during the acquisition process
- Each of the three scenario tries to compensate for the application of CT attenuation with the PET scan
- Unfortunately an adequate CT/PET technique has not been found
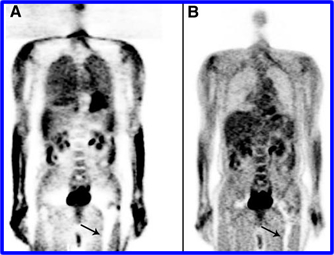
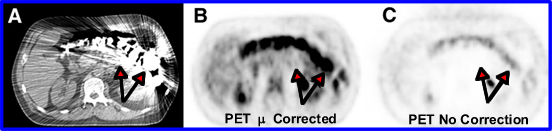
- Part of the problem is that the patient cannot hold his/her breath of 5 plus minutes in the PET scan. What actually causes the defect? Low attenuation values in CT causes counts to be subtracted out of the corrected PET image showing reduced uptake. See below
- The example given arrows point to two photopenic curves seen at the base of the lung outlining the patient's diaphragm
- In this scenario the patient was asked to take a deep breath and "hold it" during the CT acquisition. Clearly the motion defect is seen on the corrected PET images
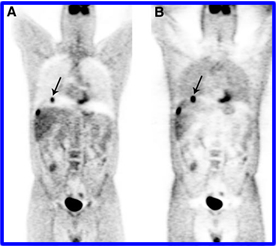
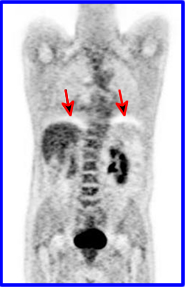
- This study the question comes up, exactly where is the lesion? (A) Shows the corrected PET/CT images and it looks like the lesion is located exactly in the middle of the motion defect. (B) The raw PET image showing that the lesion is actually located in the liver
- Contrast - Venous and Oral contrast
- IV and oral contrast agents contain attenuating compounds that allows the radiologist to see vascular and GI structures, respectively. These agents contain iodine or barium sulfate. Given the right mixture in the presence of a contrast agent the positron emitting radiopharmaceutical corrected with CT may generate false information
- Whether IV or oral the problem is similar to the above metallic issue. Iodine and barium increase attenuation within the body habitus. This increases attenuation is then reflected in the corrected PET data by increasing the counts in the same region
- The specifics of IV contrast
- Usually IV contrast agents are quickly filtered out of the body as well as quickly diluted by the patient's vascular system. Therefore, as a general rule, CT attenuation with IV contrast does not create any issue
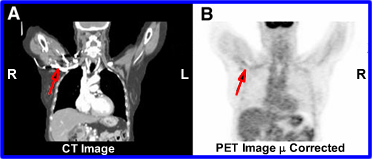
- In addition, when IV contrast is used CT usually acquired two sets of images: one with contrast and the other without. If the IV contrast images are used to generate attenuation coefficients for PET the above problem occur. The red arrow (A) shows contrast in the CT scan and (B) shows a falsely high counts density in the corrected PET
- When considering oral contrast what happens with chyme as it moves through the GI tract .. water is removed and solid material becomes denser. Now add barium sulfate to the mix. The more solid/concentrated the barium becomes the greater its density via attenuation
- As noted in the above images these higher : values cause an over correction of counts in the corrected PET image (B). However, with the raw data (C) a false positive diagnosis is prevented
- Truncation
- Truncation is a CT phenomena that occurs when the patient's width is beyond that of the CT's FOV. When this happens CT cuts off/truncates that part of the anatomy. This occurs whenever the patient's diameter is greater than of the imaging system. The FOV for CT and PET are 50 and 70cm
- Usually truncation can be prevent if the patient is imaged with arms above the head. However, in larger patients truncation can still happen since the body, with arms out of the way, may extend beyond CT's FOV
- When truncation happens one or two things may occur
- The lack of CT : values in the truncated area means that there are no correction values applied to the PET image where truncation begins. Therefore, in the truncated area corrected PET image will have a reduced counts density
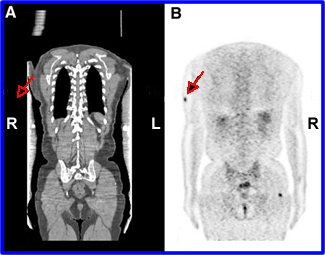
- Sometimes a streaking artifact occurs at the point of truncation causes higher : values at the same point. In turn, the corrected PET image (B) may show increased counts in the form of a hotspot. In the example given the patient has metastatic melanoma and the arrow identifies a false positive area where streaking occurred in CT and increased counts where given to PET
Return to the Beginning of the Document
Last Lecture - SPECT/PET System
Return to the Table of Content
This entire presentation including the images came from the following article: PET/CT Imaging Artifact by Sureshbabu, W and Mawlawi O, Journal of Nuclear Medicine Technology Volume 33, Number 3, 2005 156-161
For more information on how CT attenuation works with PET I suggest you read, "Attenuation correction for a combined 3D PET/CT scanner" by P. E. Kinahan,a) D. W. Townsend, T. Beyer, and D. Sashin