What Affects Resolution in PET Imaging
- Spatial resolution of a PET imaging system
- Detector size
(Ri)
- Related to detector size at its surface, this determines the system's intrinsic resolution
- Size is determined by measuring the axial plane from the center of the FOV to the opposing detectors
- Ri measures the intrinsic resolution of the scanner
- FWHM can be determined with several points to consider
- In general, the center of the FOV has the best resolution
- Resolution deteriorates as you progress to any edges of the FOV
- Likewise, from a single from a single bed - at its edges resolution deteriorates
- In addition, remember the effects of elongation
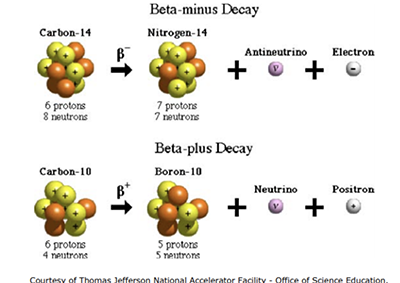
- Range of the positron (Rp)
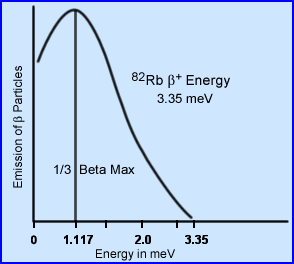
- Beta plus and minus work exactly the same way when it comes from energy being imparted to the particle β+ generating an average range referred to as 1/3 betamax
- Therefore, the average energy given to the exiting particle is 1/3 of maximum energy imparted to the proton while the remaining amount of energy goes to the ν
- However, the amount of energy give to the particle will vary by the distribution noted in the above graph - whatever energy remains is given to the neutrino (ν)
- Other factors to consider
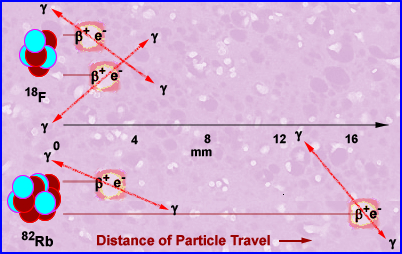
- The greater the energy given to the positron the farther a particle will travel - this effects resolution
- The greater the density of the surrounding medium, the less the particle will travel
- Compare 82Rb to 18F in water and note their energies to the distance traveled (see above diagram)
- 18F - 1/3 β-max is about 0.213 meV and with a max energy of 0.64 MeV. It can travel up to 2.2 mm in water
- 82Rb - 1/3 β-max is about 1.12 meV with a maximum energy of 3.35 meV. It can travel up to 15.5 mm in water
- The conclusion is that the greater the energy given to the particle the poorer the resolution
- According to the literature the actual affect to the FWHM is 0.2mm for 18F and 2.6mm for 82Rb
- Non-Collinearity (Ra)
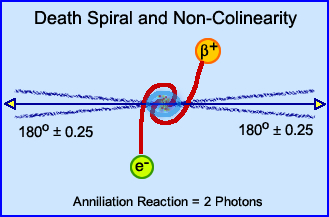
- Upon the annihilation event of a positron, there is still some residue energy (movement) that throws off the 180o coincidence
- Deviation is +/- 0.25o with an overall affect of 0.5o on the FWHM
- The further the photons has to travel within the FOV the greater the distortion
- From an annihilation event that occurs at the center of the FOV with a 90 cm scanner, displacement can be up to 2.1mm1
- Furthermore, it should be noted that displacement may worsen towards the edges of the FOV (Ri)
- Localization of detectors (Re)
- Block detectors have some error related to XY location of an LOR event where BGO have as much as 2.2mm loss of resolution
- With LSO and its increased light output Re is significantly reduced
- Selection of filter for reconstruction (Kr)
- The greater concern is the application of filtered backprojection and its cut-off frequency. If the frequency is set to allow for resolution of smaller objects, noise increases
- Increasing the noise in the image affects signal to noise ratio causing a loss in resolution
- This is one reason why iterative reconstruction is preferred over backprojection
- Formula to calculate overall spatial resolution is noted taking all components that affect resolution into account
- Sensitivity of a PET imaging system
- Is expressed as cps/μCi or cps/MBq
- A PET system's sensitivity is effected by
- Window setting
- If you reduce the window you bring less counts and reduce the system's sensitivity
- Remember in PET a large window setting is applied
- Geometric efficiency (GE) - defined as the scanner's ability to pick up the many different angles that produce an LOR
- Three components effecting this are: diameter of the FOV (distance from the event), the amount of rings in the FOV, and the amount of detectors in each ring
- Increasing the distance of an annihilation event reduces the angle resulting in a reduction of GE
- Shorter distances improve efficiency
- While increasing the amount of rings increases the angle and its efficiency
- Increasing the amount of blocks within a ring improves efficiency
- Sensitivity is best at the center of the FOV
- Crystal - based on the type of crystal used LSO has greater sensitivity when compared to BGO. In general, when discussing any type of crystal consider:
- Scintillation decay time - the shorter the better
- Increase in the AMU of the crystal increase its density and its efficiency
- Thickness should capture more photons
- Great amount of photon production follows for improved scintillation
- 2-D vs. 3-D
- 2-D has reduced sensitivity, but improved resolution with reduction of scatter and random coincidence (usually scatter and random counts are only 15 - 20% of total counts)
- 3-D has has greater sensitivity, but is caused by increased scatter and random counts. About 30 - 40% of all events recorded are scatter and random
- Reduction of deadtime with 3D will reduce scatter and random counts when TOF is applied (with the correct crystal)
- Volume sensitivity
- Expressed in either kcps/μCi/cc or cps/Bq/cc
- This unit is usually given by all manufacturers and is an evaluation of system sensitive on a uniform mixture of activity within a body of water
- Noise
and Scatter
- Noise equivalent count rate (NECR)
- Just like general nuclear medicine, the amount of counts acquired is affected by standard deviation (SD). The greater your counts or LORs the better your image quality will be and reflects a reduction in the %SD. Inversely, less counts means a greater %SD, creating more image noise
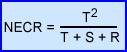
- In PET, NECR is determined by T (true counts), S (scatter counts), and R (random counts)
- Consider this relationship between 2 and 3-D acquisition
- NECR is higher with lower amounts of activity in 3D
- NECR is greater in 2-D at higher levels of activity when compared to 3-D
- The higher the NECR the lower the image noise and that's the goal!
- This value is used to evaluate different PET scanners
- Scatter Fraction (SF)

- Relates to the ratio of scatter in an PET image
- Cs is defined as scatter counts where Cp is the prompt or "true" counts
- Image quality improves as SF decreases
- Used to evaluate different PET scanners
- Contrast
- To see an object or objects there must be a variation in count densities within the surrounding media and the object must be within the resolution capacity of the imagine system

- In this formula, C (contrast) depends on the changes of count density between normal (N) and abnormal (A) tissues. Contrast is affected by:
- Patient motion
- Movement causes normal uptake to overlap abnormal uptake
- Resulting in missing disease
- Count density (counts/cm2) - counts in the acquisition - higher density = better contrast
- Size, amount of counts, and background
- Hot smaller lesions are more easily seen in areas with low background, whereas,
- Small cold lesions with high levels of background are more difficult to visualize
- Size of the object and the ability to resolve it - FWHM
- Noise vs. count density
- Statistics plays an important role where reduced LOR (counts) causes an increase in statistical variation
- Increased variation leads to increase in image noise, resulting in a loss of contrast
- Count density in tissue is dependent on
- Dose administered
- Time between injection and and scanning
- Length of scanning time
- Detector efficiency
- Scatter counts reduce image resolution
- Smaller windows around the 511 keV will reduce scatter
- Smaller windows requires an increase scanning time
- The type of display system (CRT or digital data) used to visualize the acquired results may have certain limitations to resolution
- In general, each component above affects image contrast and if just one element is significantly altered, that alteration will reduce the quality of the final product
Return to the Table of Content
2/23
Limit of Spatial Resolution in FDG-PET due to Annihilation Photon Non-Collinearity K. Shibuya, et al, IFMBE Proceedings Vol. 14/3, pp. 1666 - 1669