- Photon interaction with a solid crystal which causes scintillation
- PMTs convert the scintillation to an electron pulse
- Amplification of the pulse and discrimination circuitry
- Storage of data, application of filters, and the diagnosing of disease
- While similarities are identified there is myriad of differences. So let us begin our exploration.
- It's going to take a semester…
Starting with the Basics of Instrumentation
- In general PET does not employ collimators, however, this concept is utilized in a different manner and will be discussed later
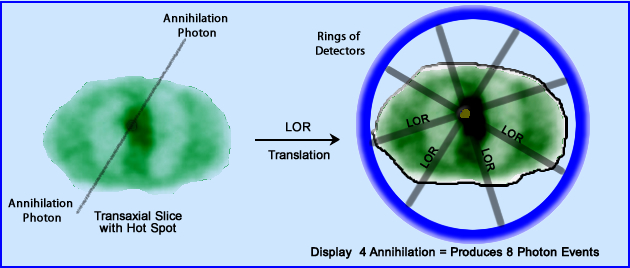
- First we have to ask, why are collimators not needed? Photon event (not gamma) radiation comes from an annihilation reaction that creates two distinct 511 keV annihilation photons traveling in opposite direction (~180o) from one another. This is known as coincidence detection because there are two photons striking the crystal, in opposite directions, at the same time. Therefore "focusing" of the events to a specific area in the gantry of the FOV. Hence septa are technically not needed since we have a good idea on where the event occurred via a photon pathway
- Sometimes literature defines this as electronic collimation, yet I have a problem with this definition
- When coincidences occur, a straight line can be drawn that connects both ends of the annihilation event as it strikes the opposing detectors. This straight lines are referred to as Line of Response (LOR). To demonstrate this concept 4 LORs are drawn through a hot spot within a tumor demonstrated as a transverse slice
- LORs are stored in the computer as sinograms (that's the next lecture)
- The hot spot is actually comprised of many LORs, all of which occur from individual annihilation events
- In relationship to regular nuclear medicine an LOR would be equivalent to count (or gamma event) being detected on a gamma camera (1 LOR = 1 count)
- As these LORs overlap each other, counts are recorded and the count density increases eventually defining a hot lesion. The more LORs the greater the resolution. In the above example, detailed information can be visualized, not just of the hot spot, but also of the surrounding tissue. While there is less concentration of the radiopharmaceutical around the lesion (this could just be background or another structure), LORs are still produced and recorded to the point where there is enough data to visualize the entire axial projection. You could also consider the concept of target to background. Question - Are there LOR in areas that we define as background?
- Concept - When an LOR is generated these means that the location of the annihilation event occurred somewhere along the path of coincidence. Therefore, the exact location is not known. In a future lecture we will discuss "Time of Flight" (TOF) which greatly enhances our ability to determine the approximate location of the annihilation event
- The PET/SPECT comparison
- In conventional SPECT imaging location of the gamma event can only be defined by lead septa plays the role of collimating the incoming photon
- Collimation in SPECT via lead septa reduces count rate which effects reduces resolution
- This is one reason why PET can resolve around 5 - 10 mm, while SPECT has a the range of 15 - 20 mm
- In addition, this improve resolution, is due in part, to increased counts via the removal of lead septa causing an increase in the amount of photon flux being detected by the imaging system
- Crystal density has to increase since we are dealing with a more energetic photon - Increased density should translate to greater "stopping power" and improved efficiency in capturing the incoming photon
- Increasing Linear Energy Transfer (LET) Increases crystal density. Do you recall where we usually apply LET?
- The amount of light being produced by the scintillation event translates to a greater amount of light means better detection
- Variations of light translates to the amount of keV of the photon gives better sensitive
- Acquiring a short decay constant, or how quickly can the electron move back into its normal energy state is yet another critical factor - if you shorten deadtime you increase the amount photon detection
- The question that needs to be considered is, why is NaI(Tl) not a viable option in the use of PET? The answer, read on, I think you will figure it out
- Why is the use of NaI(Tl) not a good idea?
- Its density is too low to capture 511 keV photons efficiently - to make an efficient NaI crystal it would need to ~ 5 inches thick (thickness of the old rectilinear scanners had this technology)
- Low (LET) and low density means poor "stopping power"
- Stopping power is defined as the mean distance a photon travels until it stops completely, depositing the energy in the crystal which causes scintillation
- Consider the table below and review the different crystal characteristics: Density, scintillation decay, photon yield, light output, energy resolution, and LET
BSO is Bismuth Germinate, LSO is Lutetium oxyorthosilicate with Ce, BaF2 Barium Fluoride, LaBr3 Lanthanum Bromide, LYSO Lutetium Yttrium OxyorthoscilicateProperties* NaI BGO GSO LSO LYSO LaBr3 BaF2 Density - gm/cm3 3.77.16.77.47.35.34.9Scintillation decay time in ns 23030060404215-250.6-0.8Photon yield in keV (%) 3861029~75632%Light Output 1001527.525-30401-12160% Energy Resolution at 511 keV 6.610.28.51014N/A10Linear attenuation Coefficient (μ) 0.34
0.950.70.830.870.480.45
*One thing that I have come across regarding the above values is that there is some variation in the literature. As an example I refer you to http://www.sinocera.net/en/crystal_lyso.asp
- Density, and μ all relate to the crystal's stopping power. In general, as the density increases so will the stopping power
- How thick does does NaI have to be in order stop a 511 keV gamma?
- Keep in mind that a gamma camera usually has a crystal thickness of 3/8 inch or about 9.5 mm
- If NaI has 9.5 mm thickness the probability of detecting a single photon event is ~12%. To record the coincidence photon event it drops to 1.4%
- If you double the thickness of the crystal you increase the detection rate to 26% for the first event and coincidence detection is about 6.8%
- If 30 mm of BGO is used the initial gamma detection is 70% with a coincidence detection of 49%
- Why is BGO stopping significantly better than NaI? (look at its μ and its density) (Gamma camera positron emission tomography by NJ Bird, SE Old, and RW Barber, The British Journal of Radiology)
- Consider thickness of the crystal and its density. Hypothetically the thicker a crystal is the poorer its energy resolution, however, the greater its stopping power. Therefore, increased density and reduced thickness should improve spatial resolution
- Based on μ values of the different crystals, NaI would have to be more than twice as thick to be able to have the same stopping power as BGO or LSO
- Opacity of the crystal is another crucial role because improved crystal clarity allows for better transfer of light scintillation
- Photon yield in keV relates to the system's sensitive and how many photons are released from scintillation when the 511 keV photon is absorbed. The greater the yield the better sensitivity the crystal has to keV variation
- Light output effect image resolution, therefore the greater the light output the greater the system's sensitivity
- Energy resolution - Greater the energy resolution the better the spatial resolution
- Scintillation decay time relates to dead time which is the crystal's ability to capture two distinct photon events. Should the crystal be in the process of scintillating and another gamma ray comes in it cannot be recorded. Therefore, the shorter the decay the better, since it can more quickly response to the next incoming event
- Further review of the crystals
- For many years BGO has been the crystal of choice and the reason for this is its stopping power. However, compare BGO to the other crystals and evaluate: μ, photon yield, energy resolution, and light output. Is there a better candidate?
- HOMEWORK - Break down the above characteristics of a crystal and rate them in descending order: decay time, photon yield, energy resolution and linear attenuation. See
- Important when considering PET/MR - A typical PMT will not function in a magnetic field, therefore semiconductor technology must be applied `
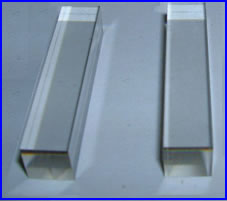
- A look at the PET crystals from Sinocera. Notice the clarity
- When comparing PET to a gamma camera technology, the role of the PMT is the same
- The key to any PMT is its ability to convert light to electrons and then proportionally increase the amount of electrons along the dynode path creating the electron pulse
- The electron pulse goes through the preamplifier to the amplifier that further increasing the size and shape of the pulse
- The electron pulse then moves on the PHA to be read, accepted or rejected
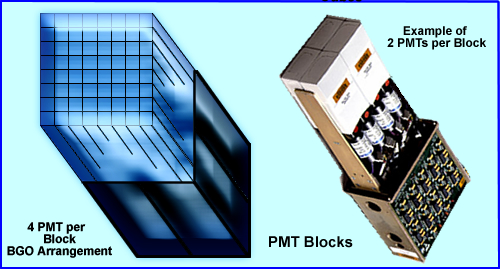
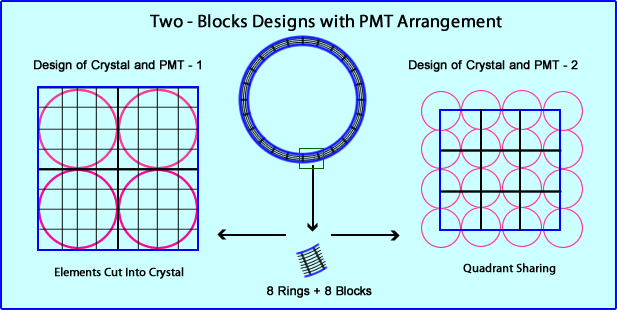
- When the crystal and PMT are combined together with PET this concept evolves (This is an example of design 1)
- Crystals are arranged in blocks where there is a set of PMTs (above 4) attached to the block (crystal) effectively catching the scintillation
- Crystal thickness (BGO) is 3 cm and contains groves/cut at various lengths
- The length of these cuts are deepest at the edge of the block with reduced lengths as you move towards the center
- The groves are filled with an opaque and reflective substance which (1) helps prevent cross-talk to the other segment of the block and (2) reflects the scintillation towards the PMT
- Each small square (3 - 5 mm) within the block will determine the spatial resolution of the system
- These small squares are referred to as elements
- In a BGO Block there are 8 by 8 elements (64) shared per PMT. In LSO/LYSO there maybe as many as 144 elements and this relates to the increase in the crystal's light output, hence the addition of elements
- Blocks Crystals and PMT Design
- Detector Blocks
- A PET gantry is composed of multiple rings
- In each ring are a series of blocks
- Within these blocks are is the scintillation crystals and attached to those crystals are the PMTs
- Crystals and PMTs are arranged in some type of 'block' arrangement that shares the location of the scintillation
- The question here is, what is the most efficient setup for the crystal and PMTs?
- Block designs
- In general, when a photon scintillates with the crystal, X, Y, and Z coordinates are identified by the specific element within the crystal block. In turn, the detector identification table reads its location and sends that data to a flood histogram.
- What is a flood histogram? A QC procedure referred to as normalization that acquire the actual locations of coincidences throughout each ring to generate uniformity corrections within each block. The histograms generate a detector identification map (See normalization scan). Hence the flood histogram is a location circuit and a correction matrix from the acquired scintillation
- Process of detection - scintillation --> X Y location -->PMT and system amplification -->PHA -->Coincidence Timing Circuit -->LOR--> Sinogram
- In some systems blocks are placed into cassette or buckets and in order for coincidence to occur it must be recorded in opposite cassette/buckets
- In design 1 all 4 PMTs are all within the the crystal block
- Prior to this design larger PMTs where placed on a sets of panels and placed into the detection ring
- By decreasing the size of the PMTs, adding cutting "elements" into crystal, reduced the amount of PMTs needed: camera resolution improved and manufacturing costs went down
- Each PMT is responsible for its scintillation and location is determined within each element
- Dead-time is less with this design when compared to design 2
- Elements within the crystal helps reduce the amount of PMTs needed, therefore reducing the system's cost
- In design 2 the PMTs overlap the crystal
- Block contains 9 PMTs
- Dead time is slower when compared to design 1
- Location of scintillation is shared between the PMTs
- PMTs are larger in diameter than design I and may be hexagon or circular in design
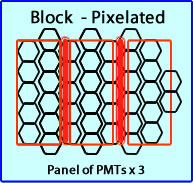
- Pixelated (Quadrant sharing)
- Set of PMTs are arranged in a panel
- Crystal is composed of GSO
- Because of the PMT arrangement each scintillation event is seen by 7 PMTs and a more exact location is identified
- Advantages indicate1
- Better positron location
- High sensitivity
- Improved count-rate
- Detector Blocks
- Blocks and Rings
- Blocks encompass 360 degrees of detection around an axial projection which allows it to capture the coincident event
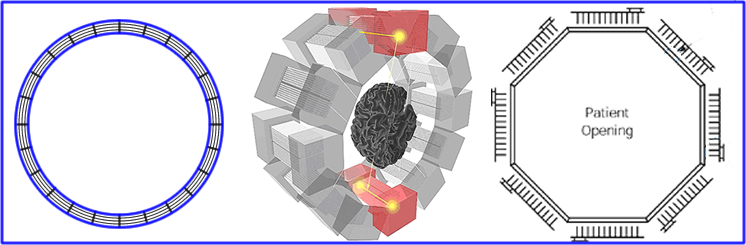
- There are different designs with these PET rings, and three different examples are noted. If you would like to know more about them place your cursor over the image and click it to go to the appropriate link
- The more popular design if a circular one
- With the PET gantry there are between 18 to 32 rings that acquire in the axial projection. Consider the advantages of more rings
- The average size of an axial acquisition is 70 cm
- In a situation where the a whole body image has to be acquired (or where the area of interest is greater than a single axial acquisition) the table moves the patient into appropriate position, acquires the data, and then moves the patient down to the next position for further data acquisition. This process continues until the entire imaging sequence is done
- While there is no such thing as collimation, there is lead between each ring which helps reduce the recording of cross-talk between the rings. This improves resolution and reduces count sensitivity
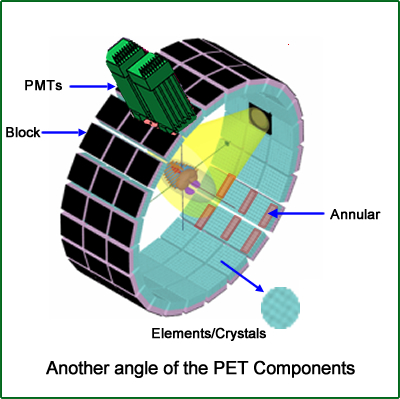
- PET Gantry Overview
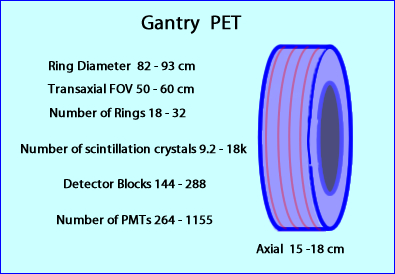
- While all PET detectors have the same components to detect the incoming photons there is a significant difference on how much there is of each component. Look at the above image for the comparison
- In general, one should be able make some assumptions
- The greater the axial dimension the more the rings
- More rings means more crystals and PMTs
- Consider the different factors above and how it may effect and/or improve image quality
- Yet another type of PET gantry can image a whole body scan in one bed
- Another view of the gantry with the components labeled
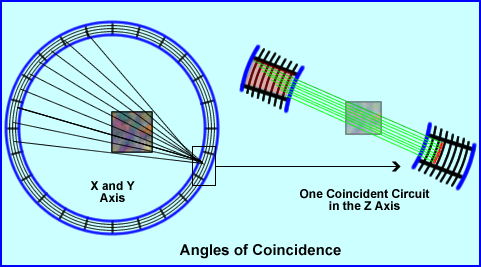
- The Coincidence factor
- The ability to detect the two 511 keV gammas and define the specific locations of the event is unique to a PET scanner
- Each element within a block is connected to a coincident circuit which is connected to all other elements in the opposite location within the ring, located in the same block. However, there is more ..
- The image above shows how angles of coincidence detection can occur in the x, y, and z planes
- The above box is emitting photons in the x and y axis (left) which demonstrates how one specific element within a block can share its event with a multitude of elements/blocks in the coincident direction
- In the Z axis one element/block within a block (colored red) can share the opposing coincident event with any element/block on the opposing side (all blocks are red)
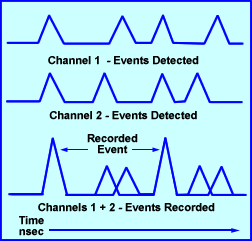
- Timing Window
- Another component to detecting a coincident event deals with coincident timing window
- The above diagram shows 2-sets of PMTs, opposite one another, picking up individual scintillations. They are labeled channel 1 and channel 2
- In order to record these 2 scintillation as coincidence they must fall within a certain time
- A "time window" is set for all elements within every block and its range of acceptance is between 4 - 12 nsec
- As the graph indicates above, if the summation of channels 1 and 2 if both fall within the window then coincidence is defined and the event is recorded (peaks 1 and 4 are summed and recorded)
- No matter how you set the timing window there will always be a certain amount of scatter detected. This is where two different annihilation events are recorded as an LOR because because to different annihilation photons are fall within the timing window. (scatter will be discussed in further detail in your next lecture)
- Remember there are several clear advantages with coincident detection
- "Electronic collimation" occurs via the detecting of coincidence. The lack of lead septa improves resolution and increases counting efficiency
- Via this technology resolution is improved when compared with SPECT
Images linked to http://pinlab.hcuge.ch/
- Essentially the same as a gamma camera, if a photon fall above or below the window it is rejected and within the window it is accepted
- What differs from a gamma camera perspective are the LLD and ULD settings. With PET the keV settings is usually set between 350 and 650 keV. This translates to a 60% window
- Here is some food for thought!
- Reducing the window improves energy resolution, by eliminating unwanted scatter
- However, limiting the window also reduces counting efficiency
- There are two rejection circuits in PET - PHA and timing window
Return to the beginning of the document
Next Lecture - LORs and Imaging
Return to the Table of Content
1/24
Suggested reading
Gamma Camera Position Emission Tomography by NJ Bird, et al. http://bjr.birjournals.org/cgi/reprint/74/880/303.pdf. This article evaluates NaI to BGO.
Introduction to PET Physics from the University of Washington, Division of Nuclear Medicine http://depts.washington.edu/nucmed/IRL/pet_intro/toc.html
1 - Imaging Characteristics of a 3-Dimensional GSO Whole-Body PET Camera by Suleman S, et al.
The book that I've read and highly suggest to all of you is: Basics of PET Imaging by Saha. A lot of the data contained within your first several PET lecture came from this book.