- 15O water
- Freely crosses the cellular membranes and perfuses into cardiac tissue
- Equilibrates quickly at ~100% extraction (why is the EF so high?)
- Allows for the calculation of myocardial blood flow, however, a disadvantage to this technique is that there are high levels of background within the blood pool (LV chamber) and surround tissues.
- 15O does perfuse into myocardial tissue, but a significant portion remains in the blood pool
- It has a very short half-life
- Because of the short T1/2 count density is poor
- C15O is used to correct for these background levels
- Two sets of images are taken 15O water defining myocardial walls and blood pool
- C15O defining the blood pool
- Subtract b into a = uptake in the myocardial walls
- 13NH3
- Clears quickly from the blood pool and perfuses into myocardial tissue via the glutaminic acid pathway
- Converts to NH4+ within the cardiac tissue (ammonia [NH3] prefers a pH of below 7.0 whereas ammonium [NH4] prefers a pH of greater than 7.0)
- Is similar to uptake when compared to FDG, however, the biopathways are different
- FDG and 13NH3 have shown to be useful in determining myocardial viability (however, there may be limitations of 13NH3)
- Advantage - Ammonia does not require patient fasting but will demonstrates significant liver uptake
- Suggested for bariatric patients to replace MIBI SPECT (for any for of PET cardiac agent)
- Cardiac stress testing is accomplished with the use of a vasodilator
- Nitrogen should be used for cardiac perfusion and not applied with cases related to viability
- What is the major disadvantage in applying 13NH3 for cardiac stress testing?
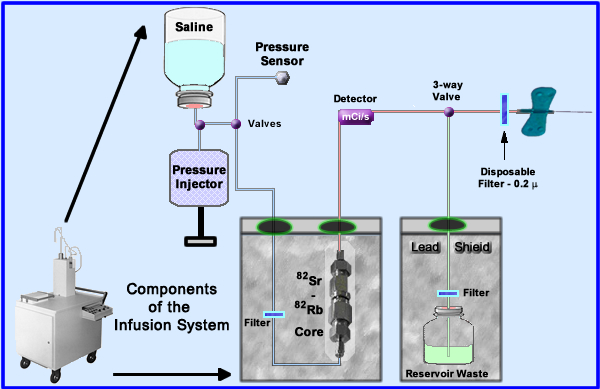
- 82Sr/82Rb generator (1)
- The generator is placed into an infusion system for patient administration. The essential components to this system are noted above
- Saline (upper left) enters the system with the assistance of a pressure injector that is controlled by the technologist
- Saline is sent through the radioactive core and then out to the patient
- Several filters are used to reduce the possibility of injecting particulate matter
- Some specifics regarding the elution and its delivery have been color coded (Saline only = blue, red = add tracer, and green = discard - not injected into patient)
- The amount of mL flow is regulated by a pressure injector
- Saline is sent to the 82Sr/82Rb core where 82Rb is extracted at a specific flow rate (should not exceed 50 mL/minute)
- Radioactive saline is monitored and measured within the delivery system
- The 3-way valve (also referred to as a divergence or solenoid valve) sends activity to the patient or diverts it to the waste reservoir
- Diversion occurs when the maximum dose has been injected into the patient
- In order to assure the system is working correctly QC is done at the beginning of ever day, where the first elution is collected and measured, but not injected into the patient. In addition, breakthrough of 82Sr and 85Sr are analyzed (the procedure is described below)
- After the first elution it acquired it takes 10 minutes for the generator to build up its 82Rb dose. Every 10 minutes the generator is ready for use
- 82Sr - has a T1/2 of 25.5 days and 82Rb T1/2 is 75 seconds
- 82Rb is a K+ analog and becomes incorporated into the sodium-potassium pump when integrating into cardiac physiology
- Package insert
- Dose criteria
- Adult single dose = 40 mCi (30 - 60mCi)
- Target organ is the kidneys
- Maximum dose: single 60 mCi, total 120 mCi (rest and stress)
- Maximum flow rate is 50 mL/min
- Volume per dose not to exceed 100mL (single), or 200 mL total
- Calculate of 82Sr breakthrough
- Relate this procedure to 99Mo breakthrough, it's just a lot more involved
- Prior to patient use elute, in the AM, 50 mL and discard it
- After 10 minutes send another 50 mL in one minute of saline through the system and collect it in a glass elution vial (do not use plastic)
- Remember the generator always requires at least 10 minutes to regenerate
- Points to consider when measuring 82Rb
- Measure 82Rb in its own window setting noting the time between measuring the activity and the time that the elution was started. You must then decay back to time zero (when the elution was started)
- Alternate window setting can be done by measure the activity in the 60Co window and dividing this value by 0.548. Once you have a reading decay it back to time zero
- Alternate method to decay back to the time zero (elution time)
- From the time that the elution was started measure the activity exactly 2.5 minutes later
- Take that value and multiple by 4. This will give you 82Rb total activity
- Once the 82Rb measurement is done let the vial decay to background. This takes 1 hour. Now the only activity remaining is the breakthrough of both Sr tracers. Enter the μCi value in the second formula. Assume the reading in 1.244 μCi
- Now determine the amount of Sr breakthrough
- Now measure the amount of 85Sr/82Sr in the vial
- Determine the ratio of 85Sr/82Sr defined as R
in the formula below
- Over time 85Sr builds up and interferes with 82Sr reading. Therefore, its R value (ratio) must be calculated
- The first value is found on the Ratio Chart found in your package insert
- The second part of the the R value is found by looking for the Sr ratio found on your calibration label of the generator
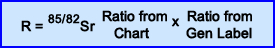
Part 1 of 2 - Once you have the R value you ready to jump down to the next formula
- Factor of F must also be applied to the formula which is always 0.478 and is a correction factor required for 85Sr
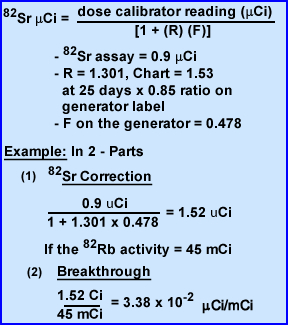
- Now that you know these values we are ready to calculate a breakthrough problem
- Activity of 82Rb - at 2.5 minutes was 11.25 mCi (11.25 x 4 = 45 mCi at time zero)
- Determine R, first look up the 85Sr/82Sr ratio on the chart for 25 days = 1.53
- The generator's label had a value of 0.85
- R = 1.3005
- Part 2 - Assume the dose Calibrator reading for 82Sr was 0.82 μCi
- You know the values of F and R, solve for corrected 82Sr = 0.82 μCi
- Apply breakthrough calculation µCi/mCi - 0.82 Ci/45 mCi = 1.82 x 10⁻² μCi/mCi
- Breakthrough must be 82Sr <2.0 x 10 -2 μCi/mCi
- 85Sr must be <0.2 μCi/mCi and is calculated by multiplying the the R value by the 82Sr activity - 1.301 x 1.82 x 10-2 μCi/mCi = 0.24 μCi of 85Sr. Is there too much breakthrough?
Part 2 of 2 - The generator is placed into an infusion system for patient administration. The essential components to this system are noted above
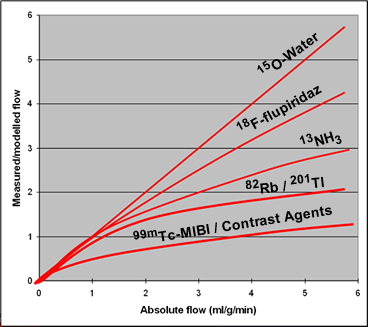
- Compare the increase of blood flow to cardiac tracers uptake. You would expect increased uptake as flow increases, in a linear fashion. However, roll off occurs, where increase in flow (stress) sees a drop off in myocardial tissue uptake. This defines the term term "rolls off." How would roll off reduce the sensitive of diagnosing ischemia heart disease?
- Comparison of the 3 major tracers mentioned
- 82Rb has a low first-pass extraction and rolls off as stress levels increase (see chart). Hence its contrast resolution is effected
- 13NH3 shows less roll off and better extraction at higher levels of stress, however, it is not linear, when compared to 15O
- 15O is the best for extraction when flow increases, however, because of its short T1/2 there is poor count density
Application of myocardial viability with the use of 18FDG
- Two states of metabolism occur with the myocardium: fatty acid and glucose
- The heart prefers fatty acids for its energy source and when the patient's has been fasting, blood sugar levels are low and fatty acid is the metabolism of choice
- When patients fast when undergoing FDG PET, approximately 80%. have reduced myocardium uptake of FDG
- However, in the case of where there is high levels of sugar in the blood (example - the patient just ate) the heart switches to a glucose metabolism for its source of energy. If FDG is injected in the metabolic state there would a significant increase in myocardial uptake
- Assessing the heart for cardiac viability with the utilization of FDG (3)
- Patient should be NPO for at least 4 hours prior to the Glucose Loading procedure
- Administer between 25 - 100 g of glucose, PO
- Once glucose is ingested it will causes the glucose level in vascular pool to increase over time and may continue elevate for approximately 60 minutes
- At one hour post dose glucose level should be taken every 15 minutes to identify the point in time in which the level begins to drop
- Once a decrease is noted, the patient is then injected with FDG. Why should FDG be injected at this point in time?
- Image the patient 45 - 60 minutes post FDG administration
- Optimal FDG uptake suggests that glucose level should be around 100 - 140 mg/dL
- Glucose-clamping procedure (3)
- Special comment - Several articles discuss this procedure where mg/dL is replaced my mM. To me the change to moles for the reading of blood glucose (BG) is confusing and causes a problem with how much insulin to administer, however, I've discovered an article by ASNC that outlines a modification to this approach and is a procedure employed by Emory University
- A fasting patient's BG is measured
- If the BG is <125 mg/dL 50% dextrose in water (D-50-W) with 25g of glucose, and 20 mg of hydro cortisone (reduces discomfort from dextrose IV is given) is administered IV
- If the BG is between 125 - 225 mg/dL D-50-W is given with 13 g of glucose
- If the BG is >225 mg/dL then unit(s) of insulin is/are given via the formula (BG - 50)/25. As an example if the BG was 250 then 4 U if insulin is administer
- At 30 to 60 minutes post glucose or insulin administration FDG is injected in the if the BG is <150 mg/dL.
- If not, re-apply the formula above, administer additional unit(s) of insulin, and recheck the BG in 30 minutes
- FDG can be given when the BG level drops to 150 mg/dL or below
- If the BG is between 150 to 200 mg/dL cardiac uptake will be of poor quality
- When is FDG used in myocardium viability?
- Usually questionable viability is first noted in a technetium MPI study via the lack of uptake in the myocardial wall
- 201Tl or FDG may be used at this point to determine to determine if there is any viable cardiac tissue in the area of question
- Uptake of FDG in the areas of question means that there is myocardial viability which in turn makes the patient a candidate for re-vascularization
- Note - up-regulation occurs with glucose when heart tissue is in a highly ischemic state to the point where it is an anaerobic environment, which causes an increase in glycolysis demanded by the myocardial cells
- Lack of FDG uptake means infarct/necrosis and requires no intervention
- Biodistribution of FDG (glucose loading) in the myocardium occurs as following
- 0 - 20 minutes FDG activity is seen mostly in the blood pool or left ventricle
- 20 - 30 minutes activity begins to perfuse into the myocardial tissue, causing a reduction of activity in the vascular pool
- 30 - 40 minutes and beyond FDG is seen mostly within the LV walls with slightly less activity at the apex. The reduced apical activity is referred to as apical dip which may be related to increase cardiac contraction and/or a partial-volume effect
- Right ventricle should not be seen, however, if it is then hypertrophy is the suspected cause and related to pressure overload, caused by congenital or pulmonary hypertension
- Comparing the energies of the different positron agents
- Has a high extraction fraction and relates and is an analog to potassium
- There are two "issues" with this cardiac agent
- Because of its 75 seconds half-life constant infusion is this tracer is required. This causes significant background in the vascular blood when imaging the LV. Therefore background subtraction is required in order to better visualize the walls of the left ventricle
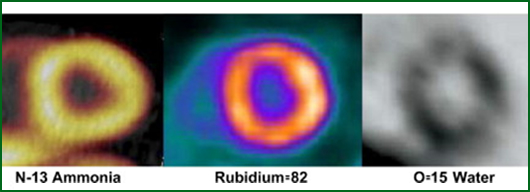
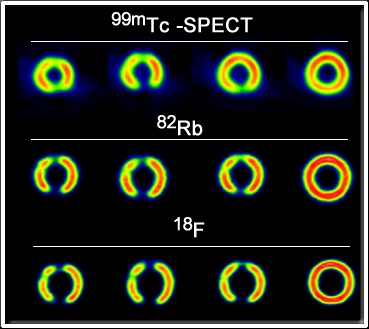
- Of all the positron agents 82Rb is the most energetic with an Emax of 3.56 MeV. It is important to realize that these positrons must first travel through issue before they annihilates. The greater its energy the farther it will travel, resulting in reduced spatial resolution. Refer to the chart below for a comparison of the different positrons we use in nuclear medicine(1)
Positron Emax (MeV) E1/3 (MeV) Max Travel (mm) Mean Travel (mm) 18F 0.633 0.2498 2.74 0.6 13N 1.1985 0.492 5.1 1.5 15O 1.732 0.735 7.3 2.5 82Rb 3.56 1.524 14.1 5.9 - The above images show slight changes in spatial resolution when compared to 99mTc, 82Rb and 18F. These images were obtained with a phantom and the positrons where attenuation in water (4)
- Time line is noted for the Rest/Stress procedure
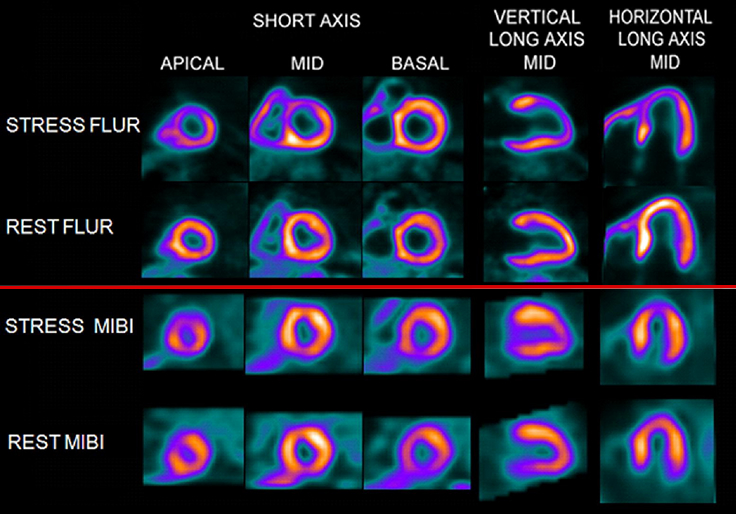
Comparison of 18F SPECT With PET in Myocardial Imaging : Methods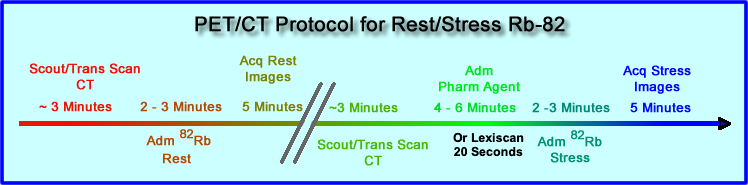
- Flurpiridaz as a myocardial perfusion agent
- Currently in phase III trials and it shows great potential
- Protocol would be similar to technetium cardiac agents where low dose rest followed by a high dose stress
- With its +90 extraction fraction it will be able to determine absolute myocardial blood flow
- Further details are available at the SNMMI website
- Flurpiridaz is compared to technetium cardiac SPECT - http://www.itnonline.com/article/flurpiridaz-f-18-may-expand-pet-myocardial-perfusion-imaging
- PET can be used to evaluate
- Any patient suspected of having CAD, even when the patient has 3 -vessel disease
- The level and area of stenosis can be determined allowing for re-vascularization of the area
- Assessment of treatment of current treatment
- Follow up surgery
- Assessment of of collateral circulation
- While all these arguments have there point the concept of applying dynamic acquisition while administering the radiotracer will have its greatest benefit
- Consider the application of Myocardial Blood Flow (MBF) and Myocardial Flow Reserve (MFR) - Link to lecture (towards the end of the PPT)
- Radiopharmaceuticals routinely in the stress arena include
- 13NH3 and 82Rb are usually the agents of choice, with 82Rb being more assessable because of its availability in generator format
- Stress and rest procedures are compared to determine tracer distribution, just like a routine MPI study
- Stress procedures are pharmacologically induced with either: persantine, adenosine, or dobutamine
- Due to these tracers short T1/2 pharmacological drug must be infused during imaging
- While bicycle exercise has been accomplished while scanning and apparently accurate in diagnosing disease, its seems somewhat cumbersome
- Diagnostic accuracy - SPECT vs. PET
- American college of Cardiology/American Heart Association/SNM concluded
- PET - 87 to 97% sensitive and 78 to 100% specific
- SPECT was 89% sensitive and 78% specific
- More data needs to be collected to further evaluate SPECT and PET
- American college of Cardiology/American Heart Association/SNM concluded