Projects
Outreach
For friends
Photo gallery
Blog
Estuarine Anoxic Zone |
|
| (Life in the Dead Zone: Microbial respiration, production, diversity and gene expression in seasonally anoxic estuarine waters (NSF-OCE 0961920), P.I.s: Byron C. Crump, Jeffrey C. Cornwell, Ian Hewson) | |
|
|
| Seasonal oxygen depletion is a common feature of eutrophic ecosystems. In a temperate climate zone, the spring freshet caused by melting ice and high precipitation results in high loads of inorganic and organic nutrients into aquatic ecosystems. In early spring, temperature and salinity differences between surface and bottom water stratify the estuarine water column and create a density gradient called a pycnocline. Then, a composite influence of the environmental changes and microbial respiration in the water column and benthic sediment oxygen demand drive the system from hypoxic to anoxic. | |
|
|
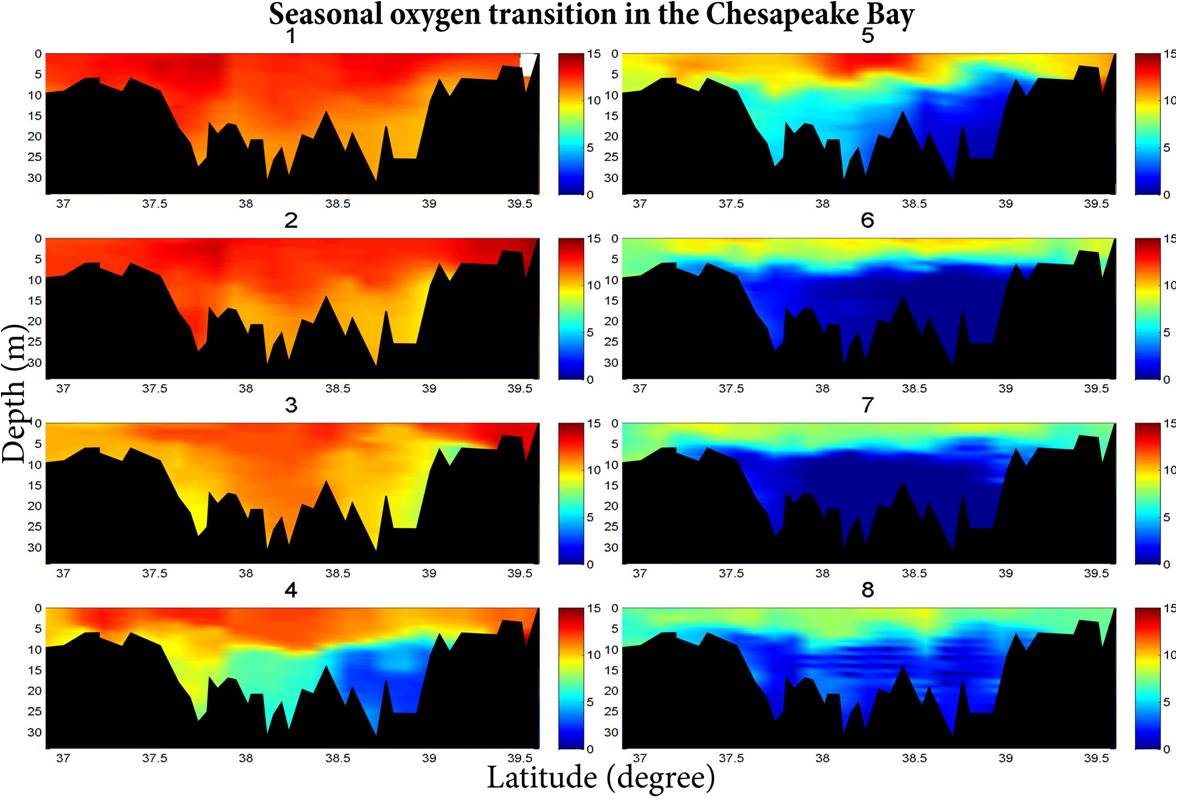
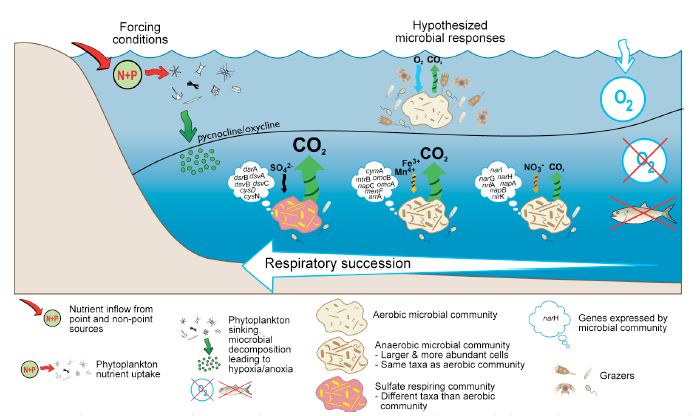
| Once the water column becomes anoxic, anaerobes initiate a succession of respiratory processes that require a sequence of terminal electron acceptors (Fig. 2). However, large uncertainties are still remain in the anaerobic metabolism budget in seasonally anoxic environments despite its importance for estimating ecosystem energy budgets. For this reason, I have been conducting fine-scale sampling throughout the water column and sediments from April to October to determine the influence of rapidly changing environmental and redox conditions on aerobic and anaerobic respiratory pathways. | |
|
|
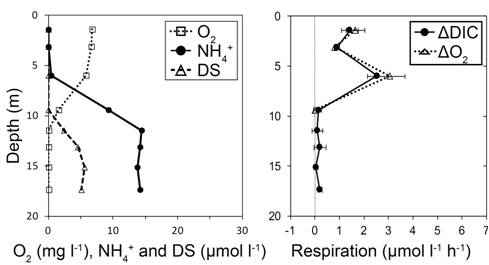
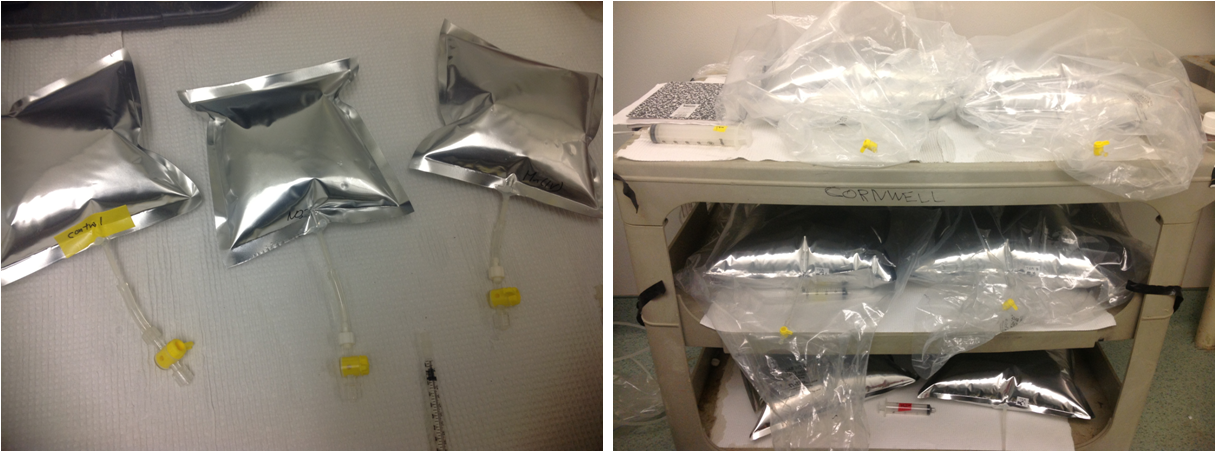
| We found a few interesting points from multiple measurements shown in Fig. 3. First, we have consistently measured maximum respiration rates just above pycnoclines (oxyclines) where oxygen (other reduced nutrients) decreased (increased) most rapidly towards sediments. Secondly, we have often observed negative respiration rates, indicating the consumption (chemical reaction) or fixation (biological reaction) of DIC around and within the pycnocline (not shown in Fig. 3). From our observations, we hypothesized that chemoautotrophic and (or) anoxygenic photoautotrophic production (e.g., nitrification and sulfur oxidation) may be responsible for not only the fixation of DIC but also the increase of total labile organic matter within and around the pycnocline. To test our hypotheses, we have been conducting experiments using air-tight bags in anoxic conditions (Fig. 4) augmented with various electron acceptors and we indeed measured chemoautotrophic production. | |
|
|
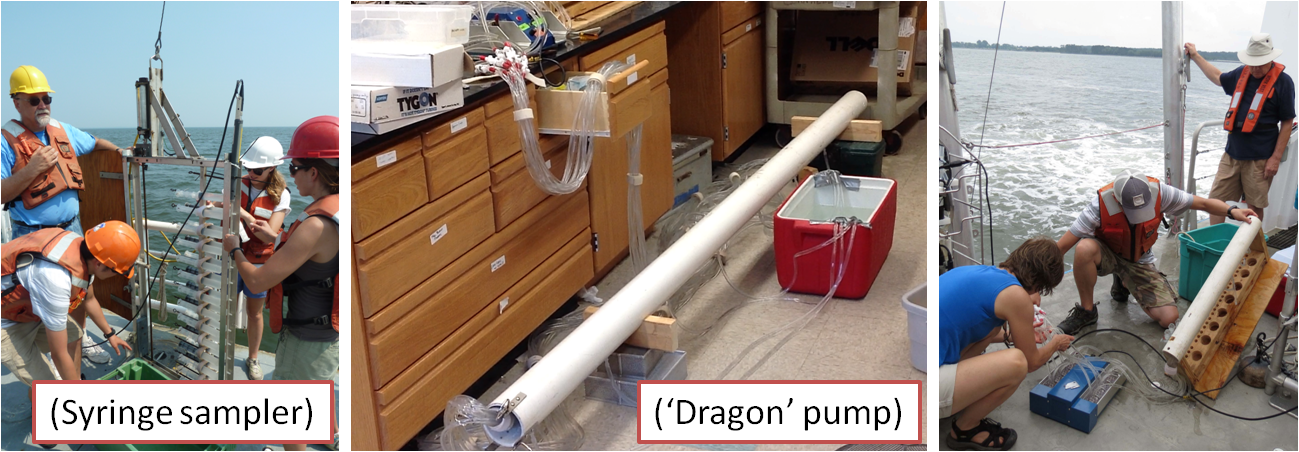
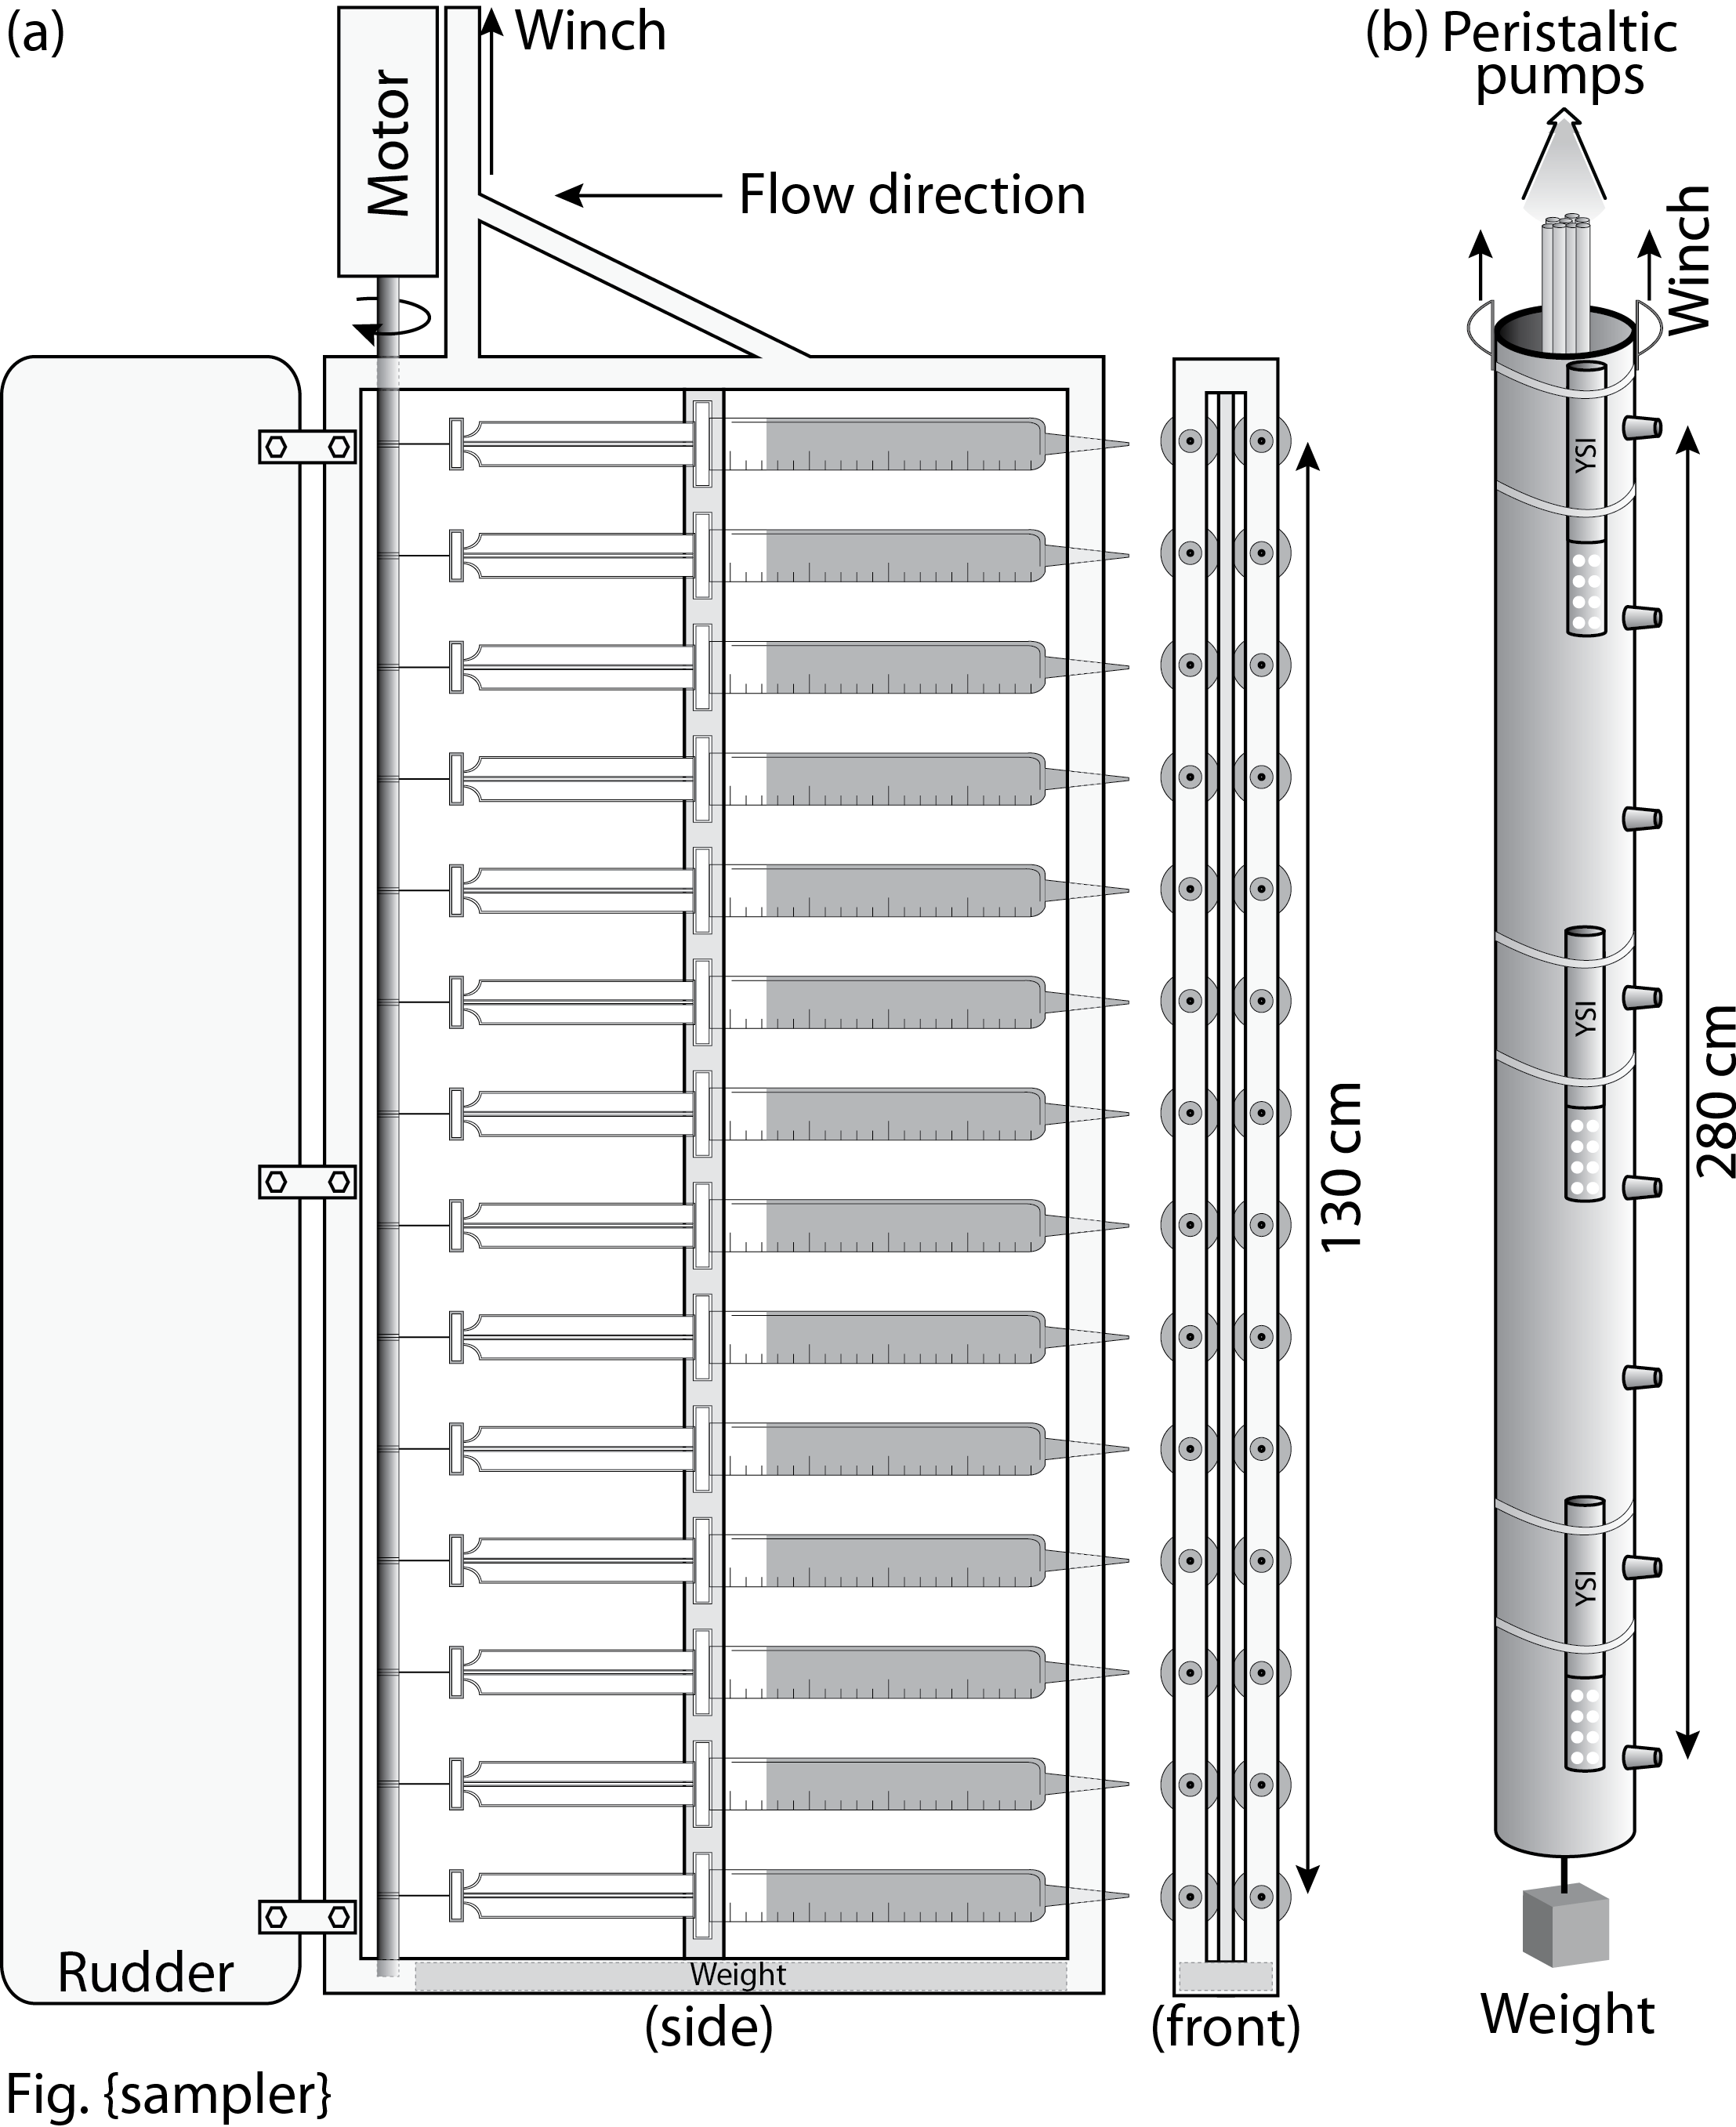
| As soon as I measured chemoautotrophic production in the water column, I realized that we have been missing (or ignoring) the production budget in estuarine budget calculations. I believe that it is essential to have finer-scale sampling devices instead of 2-meter interval sampling devices such as NISKIN rosette bottles or submersible pumps. So far, I have developed two samplers and they have been used to collect samples every 40cm within pycnoclines(Fig. 5 and 6). | |
|
|
|
|
1000 West Cary St. Room 006, Richmond, Virginia, 23284-2012
Phone: 804-827-2796
Email: dylee@vcu.edu