


Here is a compilation of important epidemiologic concepts and common biostatistical terms used in medical research: Guide to Biostatistics
(9.25.08)
Murray, W., Rashottea, L. S., & Whitmeyera, J. M. (2008). Theoretical and intuitive models. Social Science Research, 37 (1), 4-17.
Abstract
Many social processes are described only in ordinary language, though often there are advantages to stating the ideas more precisely using mathematics. Intuitive ad hoc models are less valuable than are models representing explicit theories because theoretical models are useful beyond particular situations for which they were created. We describe 13 ways in which individuals might use information about status structures and communication from others to guide their behavior, and construct simple mathematical models of the processes. Three models derive from explicit theoretical assumptions and 10 are based in intuitive ideas about how individuals process information. Next we assess empirical success of the 13 models by comparing their predictions to behavior in an experimental setting. All the models fare well by comparison with a null hypothesis of no effects of structure or interaction, but the theoretically-based models make the best predictions. We discuss some reasons for the outcomes and for the intuitive appeal of intuitive models. Both the poorer predictions and the intuitive appeal of intuitive models, oddly enough, may trace to their lack of conditionalizing their predictions.
Selected links from Steve Simon's webpage:
The Zoo of Loglinear Analysis Excerpt: "Loglinear Analysis is a multivariate extension of Chi Square. You use Loglinear when you have more than two qualitative variables. Chi Square is insufficient when you have more than two qualitative variables because it only tests the independence of the variables. When you have more than two, it cannot detect the varying associations and interactions between the variables. Loglinear is a goodness-of-fit test that allows you to test all the effects (the main effects, the association effects and the interaction effects) at the same time."
Methods for confidence interval estimation of a ratio parameter with application to location quotients. This article reviews the methods for computing a confidence interval for a ratio of two means and examines their performance using a simulation.
Confidence Intervals Involving Data to Which a Logarithmic Transformation Has Been Applied This webpage explains how to interpret a confidence interval for a difference in means for data that is log-transformed. When this interval is back-transformed to the original scale of measurement, it becomes a confidence interval for the ratio of geometric means.
Scientific Papers and Presentations (PDF) Excerpt: "Scientific communication is essential for helping us to use and take care of this earth. Researchers who discover the wonders of science must tell someone about their findings in clear, complete, and concise terms. To add to the pool of scientific knowledge, scientists must synthesize available information with what they discover. If a scientist garbles words or leaves out important points, messages become unclear, and the progress of science suffers."
The History of Human Medical Experimentation in the United States This webpage provides a detailed and harshly critical timeline of medical research. The author has an axe to grind against traditional medicine and big drug companies, but the descriptions are still valuable.
Correspondence Analysis Excerpt: Correspondence analysis is a statistical method allowing to analyze and describe graphically and synthetically big contingency tables, that is tables in which you find at the intersection of a row and a column the number of individuals who share the characteristic of the row and that of the column. This website provides a good general overview of what correspondence analysis is and how to use it.
Simplifying Repeated Measurements
A project that involved four repeat assessments on 10 different subjects. The question started out as, is my sample size 10 or is it 40?
Four repeated measurements on 10 subjects is not the same as 40 independent observations. There is almost always a positive correlation among these measurements and that implies a level of redundancy. You don't get as much information as you would with 40 independent observations.
But it is not the same as a sample size of 10 either. The repeated measurements do add a level of precision, so you have more information than if you collected a single measurement on 10 subjects.
Sometimes a design like this could be greatly simplified if you calculated a single summary statistic across the four measurements. For example, an average of the four measurements, a maximum value, or a difference between the first and last measurements might all be useful. At other times, however, such a summary would be overly simplistic and should be avoided.
It turns out that the data was categorical, so a change score or mean would be inappropriate. But the categories did have a natural ordering and selecting the maximum value was a good solution.
Repeated measurements lead to some of the most difficult problems with data management and with data analysis and the solutions are often very dependent on the context in which the repeated measurements were done.
(3.12.08)
The placebo effect is the measurable, observable, or felt improvement in health or behavior not attributable to a medication or treatment that has been administered. Link
(2.21.08)
Advice on designing scientific posters: Link
(2.21.08)
Introduction to the basic types of bias that can affect research results: Link
(2.21.08)
A Brief Guide to Questionnaire Development: Link
(2.21.08)
Bioethics Issues: Link
(2.21.08)
Overview of Computer Intensive Statistical Inference Procedures: Link
(2.21.08)
Free Effect Size Calculators
This webpage will convert various study statistics to various effect sizes: http://www.lyonsmorris.com/lyons/metaAnalysis/index.cfm
This page calculates (1) d and r using means and standard deviations; and (2) d and r using t values and df (separate groups t-test): http://web.uccs.edu/lbecker/Psy590/escalc3.htm
(11.01.07)
Factor Analysis and Hyperspace
Co-developers: Sandy Andrews, David Winograd, Natalie Schroeder
Software: Director, Strata Instant Replay, SAS/JMP, Photoshop
Media: Interactive animation
Description: There are many common misconceptions regarding factor analysis. For example, students do not know that factor analysis happens in subject space rather than variable space. Consequently, eigenvectors are misunderstood as regression lines, and data points representing variables are misperceived as data points depicting people. Subject space is omitted by many statistics textbooks and indeed it is a very difficult concept to illustrate. We developed this animated tutorial in attempt to alleviate this problem. Since the target audience is intermediate statistics students who are familiar with regression, in the program we use regression in variable space as an analogy to lead learners into factor analysis in subject space. At the end we apply Gabriel biplot to combine the two spaces together.
You can download the program for evaluation. Please email comments and corrections to alex@asu.edu
Windows version (12 meg): This zip file requires Winzip for decompression.
(10.28.07)
The Free Library (browse over 3 million free articles and books online) 
A counterfactual is a conditional (or "if-then") statement indicating what would be the case if its antecedent were true. This is to be contrasted with an indicative conditional, which indicates what is (in fact) the case if its antecedent is (in fact) true.
The difference between indicative and counterfactual conditionals can be illustrated with a pair of examples:
The first sentence is an indicative conditional that is intuitively true. The second is a counterfactual conditional that is intuitively false (or at least not obviously true).
I would argue that we should be alert to assertions that are presented as if they are an indicative conditional when in fact they are a conterfactual conditional.
P.D.
(10.26.07)
2008 Presidential Candidate Health Care Proposals: Side-by-Side Summary [link]
This side-by-side comparison of the candidates' positions on health care was prepared by the Kaiser Family Foundation with the assistance of Health Policy Alternatives, Inc. and is based on information appearing on the candidates' websites as supplemented by information from candidate speeches, the campaign debates and news reports. The sources of information are identified for each candidate's summary (with links to the Internet). The comparison highlights information on the candidates' positions related to access to health care coverage, cost containment, improving the quality of care and financing. Information will be updated regularly as the campaign unfolds.
(10.26.07)
This Issue Brief provides historic data through 2006 on the number and percentage of nonelderly individuals with and without health insurance. Based on EBRI estimates from the U.S. Census Bureau’s March 2007 Current Population Survey (CPS), it reflects 2006 data. It also discusses trends in coverage for the 1994–2006 period and highlights characteristics that typically indicate whether an individual is insured.
(10.26.07)
The cure for the headache was a kind of leaf, which required to be accompanied by a charm, and if a person would repeat the charm at the same time that he used the cure, he would be made whole; but that without the charm the leaf would be of no avail.
-Socrates, according to Plato
Various Statistics-Related Links
Flash-based Glossary of Statistical Terms
Duke University Department of Statistical Science
Gallery of Data Visualization - The Best and Worst of Statistical Graphics
USC, Berkley - Glossary of Statistical Terms
Outliers and Data Having Undue Influence
STEPS - Statistics Glassary
StatSoft Statistics Glassary
McGraw-Hill Statistics Glossary
Stattucino Applet - Stattucino is a free online spreadsheet for data analysis.
Joel Best, in his book, Damned Lies and Statistics, has a very nice argument for postmodernism when he states:
"We sometimes talk about statistics as though they are facts that simply exist, like rocks, completely independent of people, and that people gather statistics much as rock collectors pick up stones. This is wrong. All statistics are created through people's action: people have to decide what to count and how to count it, people have to do the counting, and people have to interpret the resulting statistics, to decide what the numbers mean. All statistics are social products, the results of people's efforts."
This is not to say that all statistics are bad, just that you can't interpret them without first understanding the context in which they were created.
What do you mean less than nothing? Replied Wilbur. I don’t think there is any such thing as less than nothing. Nothing is absolutely the limit of nothingness. It’s the lowest you can go. It’s the end of the line. How can something be less than nothing? If there were something that was less than nothing then nothing would not be nothing, it would be something – even though it’s just a very little bit of something. But if nothing is nothing, then nothing has nothing that is less than it is.
E.B. White, Charlotte’s Web
What is mediation? [link]
Mediator versus Moderator Variables [link]
Sobel Test Calculators
These calculators use the Sobel test to tell you whether a mediator variable significantly carries the influence of an independent variable to a dependent variable; i.e., whether the indirect effect of the independent variable on the dependent variable through the mediator variable is significant.
1. http://www.danielsoper.com/statcalc/calc31.aspx
2. http://www.psych.ku.edu/preacher/sobel/sobel.htm
SPSS and SAS Macros for Estimating and Comparing Indirect Effects in Multiple Mediator Models [link]
SPSS and SAS procedures for estimating indirect effects in simple mediation models [link to pdf ]
How Much Do Americans Depend on Social Security? [link]
Social Security benefits over the next 75 years will exceed payroll tax revenues by $4.6 trillion. To close this enormous fiscal gap, one proposal is to cut the benefits of high-income workers. Many low- income workers depend almost entirely on Social Security for their retirement income, but it is often assumed that high-wage workers can maintain their standard of living without Social Security benefits due to their private pensions and savings. Surprisingly, however, even high-wage workers depend on Social Security for a substantial portion of their retirement income and would significantly change their consumption and saving behavior in the absence of Social Security.
Specifically:
1. Social Security accounts for virtually all of the discretionary consumption of households with modest preretirement incomes (less than $50,000 a year for couples or $25,000 for singles); and
2. It is equal to about one-third of the consumption of the highest-earning households (couples with preretirement incomes of $500,000 and singles with $250,000).
Correlation coefficients in medical research: From product moment correlation to the odds ratio. H. C. Kraemer. Stat Methods Med Res 2006: 15(6); 525-45. [PDF] There are several measures of agreement (such as the phi coefficient, the point biserial correlation, and the tetrachoric correlation) that are used to show relationships when one or both variables are binary. This paper shows the interrelationships and the interpretation of these correlations and relates them to other measures not traditionally thought of as measures of correlation, such as the odds ratio.
Extreme value distributions
These distributions (e.g., Gumbel distribution) are useful for modeling the maximum or minimum of a large number of variables.Reliability statistics often consider the maximum or minimum value as an important quantity to measure. For example, if you have a machine with a large number of components, and the machine fails when any one of the components fails, then the lifetime of the machine is the minimum of the individual component failure times. Insurance companies are also interested in extreme values as they represent the worst case scenarios. A 100 year flood level also represents an extreme value distribution.
Extreme Value Distributions. Annis C.
[Excerpt] The average of n samples taken from any distribution with finite mean and variance will have a normal distribution for large n. This is the CLT. The largest member of a sample of size n has a LEV, Type I largest extreme value, also called Gumbel, distribution, regardless of the parent population, IF the parent has an unbounded tail that decreases at least as fast as an exponential function, and has finite moments (as does the normal, for example). www.statisticalengineering.com/extreme_value.htm
Extreme value distributions. Tobias P, NIST/SEMATECH e-Handbook of Statistical Methods.
[Excerpt] We have already referred to Extreme Value Distributions when describing the uses of the Weibull distribution. Extreme value distributions are the limiting distributions for the minimum or the maximum of a very large collection of random observations from the same arbitrary distribution. Gumbel (1958) showed that for any well-behaved initial distribution (i.e., F(x) is continuous and has an inverse), only a few models are needed, depending on whether you are interested in the maximum or the minimum, and also if the observations are bounded above or below. www.itl.nist.gov/div898/handbook/apr/section1/apr163.htm
Extreme Value Type I Distribution. Filliben JJ, Heckert A, NIST/SEMATECH e-Handbook of Statistical Methods.
[Excerpt] The extreme value type I distribution has two forms. One is based on the smallest extreme and the other is based on the largest extreme. We call these the minimum and maximum cases, respectively. Formulas and plots for both cases are given. The extreme value type I distribution is also referred to as the Gumbel distribution. www.itl.nist.gov/div898/handbook/eda/section3/eda366g.htm
Extreme value theory. Wikipedia.
[Excerpt] Extreme value theory is a branch of statistics dealing with the extreme deviations from the median of probability distributions. The general theory sets out to assess the type of probability distributions generated by processes. Extreme value theory is important for assessing risk for highly unusual events, such as 100-year floods. en.wikipedia.org/wiki/Extreme_value_theory
A rather unusual approach to extreme values has been advocated by Benoit Mandelbrot, probably the most famous name in the area of fractal geometry.
Q&A with Benoit Mandelbrot. Wright CM, National Association of Real Estate Investment Trusts.
[Excerpt] Forget Euclidean geometry with its smooth lines and planes. Now comes Benoit Mandelbrot, the inventor of fractal geometry, who recently wrote an entertaining and challenging book, "The (mis)Behavior of Markets," in which he argues that his study of roughness, already applied to topography, meteorology, the compression of computer files, and many other fields, will rewrite the canon on finance. Portfolio asked the Yale University mathematics professor, among other things, how real estate prices look under the fractal microscope. www.nareit.com/portfoliomag/05mayjun/capital.shtml
Mandelbrot's Extremism [PDF]. Beirlant J, Schoutens W, Segers J, Published December 6, 2004.
[Abstract] In the sixties Mandelbrot already showed that extreme price swings are more likely than some of us think or incorporate in our models. A modern toolbox for analyzing such rare events can be found in the field of extreme value theory. At the core of extreme value theory lies the modelling of maxima over large blocks of observations and of excesses over high thresholds. The general validity of these models makes them suitable for out-of-sample extrapolation. By way of illustration we assess the likeliness of the crash of the Dow Jones on October 19, 1987, a loss that was more than twice as large as on any other single day from 1954 until 2004. www.kuleuven.ac.be/ucs/research/reports/2004/report2004_08.pdf
The work by Mandelbrot may not be useful in the context of the original question, but it is still a fascinating and very active area of research.
The Taxonomy of Logical Fallacies (Gary N. Curtis). Understanding flaws in the process of of advocating a particular viewpoint is an important component of critical thinking. You can understand these flaws better if you can ascribe them to a particular category. URL: www.fallacyfiles.org/taxonomy.html
Advice on designing scientific posters (Colin Purrington). Good practical advice, especially for beginners on how to design and present a scientific poster. URL: www.swarthmore.edu/NatSci/cpurrin1/posteradvice.htm
Ed Rigdon's SEM FAQ. A place to look iif you have questions about Structural Equation Models. URL: www2.gsu.edu/~mkteer/semfaq.html
Clinical Trial: t he viewpoint of children J Cherrill, H Hudson, C Cocking, V Unsworth, L Franck, J McIntyre and I Choonara. Archives of Disease in Childhood 2007;92:712-713. [Medline] [Abstract] [Full text] [PDF] How well do children understand the research process? This paper summarizes a semi-structured interviews of 30 children from 8 to 16 years old. Most of these children understood that there were risks associated with participating in a clinical trial and had a variety of opinions about financial incentives.
http://www.people.vcu.edu/%7Epdattalo/Character_Stripper/Character%20Stripper.htm
This primer provides an overview of the basic components of the nation’s largest health coverage program that covers 55 million low-income individuals (including families, people with disabilities and the elderly) and is the dominant source of the country’s long-term care financing. It examines the structure of Medicaid, who the program covers, what services it provides and spending. Because Medicaid is jointly financed by the federal and state governments and the states administer the program within broad federal guidelines, programs vary across states. Tables examining the state-to-state variation in eligibility, enrollment and spending for Medicaid enrollees are included.
(3/30/07)
When the Medicare Part D prescription drug legislation was being developed, Congress and the Bush Administration decided to specifically prohibit the Medicare program from bargaining with pharmaceutical companies to secure lower drug prices. This controversial decision took the responsibility for moderating drug prices away from the Medicare program and, instead, placed it in the hands of private drug plans. One full year after the implementation of Part D, the unfortunate consequence of this decision is clear—private plans have failed to deliver low prices. The ability of private plans to secure low drug prices is critically important, both to America’s seniors and to taxpayers. Drug prices set by private Part D plans significantly affect premiums and how much beneficiaries end up paying out of pocket overall. These drug prices also have a direct effect on the burden borne by taxpayers, who pay approximately three-fourths of the costs of the Part D program.
(3/30/07)
Something to ponder in your free time:
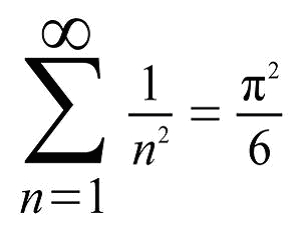
That is, the sum of the infinite series
1/1 + 1/4 + 1/9 + 1/16 + 1/25 + ...
is pi times pi divided by 6, where pi is the familiar ratio of the circumference of a circle to its diameter.
This formula was discovered by the great Swiss mathematician Leonhard Euler (1707-1783).
(11/3/06)
Amazin Clock - Must be viewed in IExplorer 6 or greater, and "Allow Blocked Content"
BMC Medical Research Methodology, 6, 1-58 - Selected Articles (11/3/06)
Dealing with missing data in a multi-question depression scale: a comparison of imputation methods
Performance of statistical models to predict mental health and substance abuse cost
A system for rating the stability and strength of medical evidence
Re-interpreting conventional interval estimates taking into account bias and extra-variation
The relationship between quality of research and citation frequency
Increasing recruitment to randomised trials: a review of randomised controlled trials
Meta-DiSc: a software for meta-analysis of test accuracy data
Does updating improve the methodological and reporting quality of systematic reviews?
The fading of reported effectiveness. A meta-analysis of randomised controlled trials
Optimizing search strategies to identify randomized controlled trials in MEDLINE
Identifying systematic reviews of the adverse effects of health care interventions
Scratch lottery tickets are a poor incentive to respond to mailed questionnaires
Evaluation of QUADAS, a tool for the quality assessment of diagnostic accuracy studies
Room for improvement? A survey of the methods used in systematic reviews of adverse effects
(An end-of-semester/prelude-to-next-semester kind of poem!) (11/19/06)
God's Grandeur
...Generations have trod, have trod, have trod;
And all is seared with trade; bleared, smeared with toil;
And wears man's smudge and shares man's smell: the soil
Is bare now, nor can foot feel, being shod.
And for all this, nature is never spent;
There lives the dearest freshness deep down things;
And though the last lights off the black West went
Oh, morning, at the brown brink eastward, springs...
Educational Attainment in the United States 2005 [link] (11/3/06)
Read more [link] 10/21/06
Abstract
This report describes my experiences using general purpose statistical software over 20 years and for over 11 years as a statistical consultant helping thousands of UCLA researchers. I hope that this information will help you make strategic decisions about statistical software (the software you choose to learn, and the software you choose to use for analyzing your research data). www.ats.ucla.edu/stat/technicalreports/Number1/ucla_ATSstat_tr1_1.0.pdf
Abstract
Little is known about researchers’ understanding of confidence intervals (CIs) and standard error (SE) bars. Authors of journal articles in psychology, behavioral neuroscience, and medicine were invited to visit a Web site where they adjusted a figure until they judged 2 means, with error bars, to be just statistically significantly different (p <.05). Results from 473 respondents suggest that many leading researchers have severe misconceptions about how error bars relate to statistical significance, do not adequately distinguish CIs and SE bars, and do not appreciate the importance of whether the 2 means are independent or come from a repeated measures design. Better guidelines for researchers and less ambiguous graphical conventions are needed before the advantages of CIs for research communication can be realized.
Abstract
Analysis of continuous variables sometimes proceeds by selecting individuals on the basis of extreme scores of a sample distribution and submitting only those extreme scores to further analysis. This sampling method is known as the extreme groups approach (EGA). EGA is often used to achieve greater statistical power in subsequent hypothesis tests. However, there are several largely unrecognized costs associated with EGA that must be considered. The authors illustrate the effects EGA can have on power, standardized effect size, reliability, model specification, and the interpretability of results. Finally, the authors discuss alternative procedures, as well as possible legitimate uses of EGA. The authors urge researchers, editors, reviewers, and consumers to carefully assess the extent to which EGA is an appropriate tool in their own research and in that of others.
Abstract
A broad theory of scientific method is sketched that has particular relevance for the behavioral sciences. This theory of method assembles a complex of specific strategies and methods that are used in the detection of empirical phenomena and the subsequent construction of explanatory theories. A characterization of the nature of phenomena is given, and the process of their detection is briefly described in terms of a multistage model of data analysis. The construction of explanatory theories is shown to involve their generation through abductive, or explanatory, reasoning, their development through analogical modeling, and their fuller appraisal in terms of judgments of the best of competing explanations. The nature and limits of this theory of method are discussed in the light of relevant developments in scientific methodology.
* Age-adjusted to the 2000 U.S. standard population using four age groups: <18 years, 18--44 years, 45--64 years, and >65 years.
† 95% confidence interval.
During 1999--2002, approximately 50% of females and 40% of males reported using at least one prescription drug during the preceding month, with non-Hispanic whites more likely to do so than non-Hispanic blacks and Mexican-Americans. In each racial/ethnic population, females were more likely than males to have used at least one prescription drug during the preceding month.
Sources: National Center for Health Statistics. Health, United States, 2005. Table 91. Hyattsville, MD: National Center for Health Statistics; 2005. Available at http://www.cdc.gov/nchs/hus.htm; National Health and Nutrition Examination Survey, 1999--2002. Available at http://www.cdc.gov/nchs/nhanes.htm.
Full article is here
(1/19/06)
Physicians are immersed in stories. They hear stories from patients, tell them to other physicians, and recall them in quiet moments. Literary scholars, folklorists, and historians have long emphasized the importance of stories. In recent years, physicians trained in these disciplines have considered the role of stories in clinical practice. The physician-anthropologist Kleinman suggests that physicians need to move beyond "clinical interrogation" to listen attentively to their patients’ narratives of illness. Charon draws on her background in literary studies to suggest that the practice of medicine requires "narrative competence," which she defines as "the set of skills required to recognize, absorb, interpret, and be moved by the stories one hears or reads. She further proposes that physicians can enhance their clinical and emotional development through retelling clinical stories.
Abstract
In celebration of Einstein's remarkable achievements in 1905, this essay examines some of his views on the role of “intellectuals” in developing and advocating socio-economic and political positions and policies, the historical roots of his ethical views and certain aspects of his philosophy of science. As an outstanding academic and public citizen, his life and ideas continue to provide good examples of a life well-used and worth remembering.
Problems with measuring socioeconomic status (SES)—frequently included in clinical and public health studies as a control variable and less frequently as the variable(s) of main interest—could affect research findings and conclusions, with implications for practice and policy. We critically examine standard SES measurement approaches, illustrating problems with examples from new analyses and the literature. For example, marked racial/ethnic differences in income at a given educational level and in wealth at a given income level raise questions about the socioeconomic comparability of individuals who are similar on education or income alone. Evidence also shows that conclusions about nonsocioeconomic causes of racial/ethnic differences in health may depend on the measure—eg, income, wealth, education, occupation, neighborhood socioeconomic characteristics, or past socioeconomic experiences—used to "control for SES," suggesting that findings from studies that have measured limited aspects of SES should be reassessed. We recommend an outcome- and social group–specific approach to SES measurement that involves (1) considering plausible explanatory pathways and mechanisms, (2) measuring as much relevant socioeconomic information as possible, (3) specifying the particular socioeconomic factors measured (rather than SES overall), and (4) systematically considering how potentially important unmeasured socioeconomic factors may affect conclusions. Better SES measures are needed in data sources, but improvements could be made by using existing information more thoughtfully and acknowledging its limitations.
Link: http://www.meps.ahrq.gov/papers/st102/stat102.pdf
Highlights
-Families without an elderly member were more than three times as likely not to have an out-of-pocket expense for prescription drugs (19.2 percent) than families with an elderly member (5.4 percent) during 2002.
-Families with an elderly member had prescribed drugs out-of-pocket expenses that accounted for greater than 5 percent of family income at a much greater rate (30.8 percent) than families without an elderly member (6.8 percent).
-Families who spent greater than 5 percent of their income on out-of-pocket expenses for prescribed drugs were more likely to report an unmet need (15.4 percent) than families who spent less than or equal to 5 percent of their income (6.3 percent).
-The majority of families with an unmet need during 2002 reported a financial cause as the sole or partial reason for the problem (66.3 percent).
Abstract
This paper studies how education and certain lifestyle factors affect people's self-reported health. In addition to the assessment of the effects of education and lifestyle, the study contrasts two models of explaining educational-related health inequalities: the mediation model and the moderator model. The mediation model posits that well-educated people's better health, as compared to the poorly educated, is caused by their more ‘healthy’ lifestyles. The moderator model suggests, by contrast, that the effects of the lifestyle variables on health are dependent upon educational level. Several analyses are carried out on two large data sets comprising of middle-aged men and women in two Norwegian counties, Rogaland and Nordland. Two main findings are presented: (1) Both education and lifestyle factors have the expected effects on health. (2) The results do not permit a clear-cut conclusion as to which of the two models of educational-related health inequalities should be preferred: whereas the results support the mediation model in the data from Rogaland, the moderator model is partially supported in the Nordland data.
Abstract
This study examined Portuguese Canadian and Caribbean Canadian immigrants’ perceptions of health research and informed consent procedures. Six focus groups (three in each cultural group) involving 42 participants and two individual interviews were conducted. The focus groups began with a general question about health research. This was followed by three short role-plays between the moderator and the assistant. The role-plays involved a fictional health research study in which a patient is approached for recruitment, is read a consent form, and is asked to sign. The role-plays stopped at key moments at which time focus group participants were asked questions about their understanding and their perceptions. Focus group transcripts were coded in QSR NUDIST software using open coding and then compared across cultural groups. Six overriding themes emerged: two were common in both the Portuguese and Caribbean transcripts, one emphasized the importance of trust and mistrust, and the other highlighted the need and desire for more information about health research. However, these themes were expressed somewhat differently in the two groups. In addition, there were four overriding themes that were specific to only one cultural group. In the Portuguese groups, there was an overwhelming positive regard for the research process and an emphasis on verbal as opposed to written information. The Caribbean participants qualified their participation in research studies and repeatedly raised images of invasive research.
A "peeve" is something that annoys or irritates you, and since irritation is a highly individual emotion, one's "peeve" mileage may vary from one's neighbor's. I am "peeved," for instance, by people who assume that my license plates (which refer rather cryptically to books) mean that I spend every waking hour rooting for the Ohio State Buckeyes. Buckophiles, conversely, are probably peeved at the cool disdain with which I disclaim any pro-Buckeye sentiments.
For a word that expresses a universal (one presumes) human emotion, "peeve" is a remarkably recent coinage, first appearing in print as a verb only in 1908 and a noun (the thing that peeves) in 1911. Both "peeves," however, arose as what linguists call "back-formations" of the much older term "peevish," meaning "ill-tempered," that first appeared in the late 14th century. Back-formations, the derivation of a "root" word from a more complex form, are common in English -- the verb "to sculpt," for instance, was formed from the much older word "sculptor."
The precise derivation of "peevish" is uncertain, but it may be related to the Latin "perversus," meaning "reversed, perverse." The original meaning of "peevish" was simply "silly or foolish," but by about 1530 it had acquired the sense of "irritable, ill-tempered or fretful." Surprisingly, it then took several hundred years to develop "peeve" as the word for the irritating agent or action. "Pet peeve," meaning the one thing that annoys you more than anything else, first appeared around 1919. The "pet" (in the sense of "favorite") formulation probably owes its popularity and longevity to its mild perversity ("favorite annoyance" is a bit oxymoronic) as well as its snappy alliteration.
Someone wrote asking about how best to use stepwise regression in a research problem where there were a lot of potential covariates. A covariate is a variable which may affect your outcome but which is not of direct interest. You are interested in the covariate only to assure that it does not interfere with your ability to discern a relationship between your outcome and your primary independent variable (usually your treatment or exposure variable).
The writer offered up a couple of approaches. First, include all the covariates (but not the primary independent variable) in a stepwise regression model and then adjust your primary independent variable for those covariates which survive the stepwise regression. Second, include all the covariates and the primary independent variable in a stepwise regression model and then report the final model. If the final model fails to include your primary independent variable, that is just evidence that your primary hypothesis is negative.
The person who wrote in was well aware of the weaknesses of stepwise regression, but for those of you who are not familiar with those weaknesses, please read
What are some of the problems with stepwise regression?
which is a summary I made of comments about stepwise regression by Ira Bernstein, Ronan Conroy and Frank Harrell that were published on the email discussion list, stat-l.
The research community is gradually moving away from stepwise regression to other more sophisticated methods, but for now you can probably get a stepwise regression model published in most medical journals. Furthermore, there is no established method for how to use stepwise regression, so you are free to use any approach that is not totally outrageous. Here are some general comments, though.
First, if your goal is to assure that no confounding variables produce an incorrect relation between exercise and breast cancer, then the safest thing to do is to include all the potential covariates in the model and not worry about which ones pass some threshold for inclusion in the model. The drawback to this approach, of course, is that you lose a lot of degrees of freedom.
Second, never let a stepwise regression model violate your notion of common sense. If a particular covariate is known to be important (e.g., cigarette smoking in a cancer study) then exclusion of this covariate on the basis of a stepwise regression approach is a mistake. I like to think of stepwise regression as an intelligent assistant. It offers some help and guidance, but don't let it dictate the form of your final statistical model.
Third, never let stepwise regression bypass your primary research hypothesis. If a stepwise approach tosses out your primary independent variable, force it back into the equation anyway at the end, because you need to see the confidence interval and p-value associated with this variable.
Finally, as noted above, there are some new approaches that compete very well against stepwise regression in this particular situation. You should examine the use of propensity scores (which I hope to write an example for soon), as these offer all the advantages of including all possible covariates and none of the disadvantages. There is also a book by Frank Harrell on regression modeling approaches that is well worth reading.
Regression Modeling Strategies: With Applications to Linear Models, Logistic Regression, and Survival Analysis. Harrell FE (2001) New York, NY: Springer. ISBN: 0387952322. [BookFinder4U link]
(A, worth-reading, discussion of power analysis and sample size.) (11/27/05)
Over the past 40 years, the Head Start program has delivered early education and support services to 23 million low-income preschool children and their families. In 1995, Head Start expanded to serve children from birth to age 3 and pregnant women through the Early Head Start program. In addition to early education, Head Start programs must provide children and families with access to a range of comprehensive services, including parenting resources, health screenings and follow-up, and social services.
Search engines have become an increasingly important part of the online experience of American internet users. The most recent findings from Pew Internet & American Life tracking surveys and consumer behavior trends from the comScore Media Metrix consumer panel show that about 60 million American adults are using search engines on a typical day. These results from September 2005 represent a sharp increase from mid-2004.
The best way to measure the impacts of many important educational interventions is to randomly divide schools into a treatment group, which receives the intervention, and a control group, which does not — and then to compare future student achievement outcomes for the two groups. This paper examines how controlling statistically for baseline covariates (especially pretests) improves the precision of studies that randomize schools.


(updated 11.19.06)