Data mining techniques are becoming indispensable as the amount and complexity of available data is rapidly growing. Visual data mining techniques attempt to include a human observer in the loop and leverage human perception for knowledge extraction. This is commonly allowed by performing a dimensionality reduction into a visually easy-to-perceive 2D space. However, in case of multi-dimensional datasets such dimensionality reduction can results in significant loss of important spatial and topological information. To address this issue, this paper presents the design and implementation of a unique 3D visual data mining framework – CAVE-SOM. The CAVE-SOM system couples the Self-Organizing Map (SOM) algorithm with the immersive Cave Automated Virtual Environment (CAVE). The SOM is used to perform dimensionality reduction of large multi-dimensional datasets into a 3D space. The CAVE system is then used for immersive visualization of the trained 3D SOM structure. The advantage of the CAVE-SOM system is that it allows the user to explore and interact with the multi-dimensional data in an intuitive and natural way using multiple visualization modes such as histogram, U-matrix, connection, separation, uniqueness and the input space view in a fully 3D virtual environment. The implemented CAVE-SOM framework was validated on several benchmark problems and then successfully
"UI-CAES Modeling and Simulation", IUC-ACE (Idaho Universities Consortium-Academic Center of Excellence), April 2010 - September 2012.
- D. Wijayasekara, O. Linda, M. Manic, “CAVE-SOM: The Immersive Visual Data Mining Based on 3D Self-Organizing Map with Application in Wind Power Analysis”, Int. Joint Conference on Neural Networks, IJCNN 2011, San Jose, California, July 31-Aug.5, 2011.Papers Abstract PDF
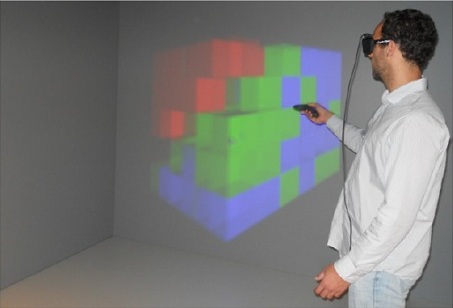
The figures below show the CAVE environment with the displayed 3D SOM structure. The user can see the visualized data in a fully immersive 3D environemnt and can explore the data using 6D input tool.

|
|
The figure below depicts the 3D SOM structure used to visualized 10 dimensional data set with 4 Gaussian clusters. It can be seen that the 4 multi-dimensional clusters are easily visible in the trained 3D SOM.

|

|
The CAVE-SOM system was applied to the problem of understanding and analysing wind power generation data. The figures below show a comparison of wind power generation datasets in two geographically different regions in Idaho and in Colorado. The implemented uniqueness view displayed on the left enlarges SOM neurons that were unique for either dataset allowing thus rapid focus on data features that could be observed in one geographical region but not the other one. This tool can be used in helping to understand the difference of wind power production in vaious regions.

|

|