Acquisition Parameters in SPECT
- Imaging characteristics of SPECT
- Effects of depth in SPECT
- Resolution is not as good when compared to SPECT
- Cause - Acquisition of all objects includes those from a distance are acquired and presented in a 3D matrix
- Planar resolution is better
- Body contouring and longer septa improves resolution
- Some reconstruction programs (iterative) also helps - with BKG and noise
- Background and its effect
- Increase the acquisition angles increases your BKG
- FBP, as noted earlier, further increase your BKG referred to as "structured background" caused by the overlapping of 2D images
- Where is structured background?
- Ramp filters and iterative reconstruction may reduce or eliminate this problem
- Noise
- Limited acquisition time per slice significantly increases noise
- Noise is based on the counts per slice and not the total counts found in the 3D matrix
- Noise becomes amplified with image reconstruction, increasing the density of noise
- Blending a ramp with low frequency filter (roll-off) becomes essential to improve image quality
- However, exactly how many true counts, BKG, and noise being adjusted (removed) during reconstruction is impossible to define. Looking at the reconstructed images is the only qualitative aspect that allows you to evaluate your filtering/reconstruction data. You could say that this process is very technologist dependent
- Attenuation and scatter with 99mTc
- ~25% of gammas will be lost to attenuation
- This increases noise since there is a loss of counts
- ~50% of gamma rays that are recorded undergo some amount of Compton scatter
- This reduces contrast
- Patient motion
- This is very critical and requires the technologist to explain to the patient how important it is, not to move, during the acquisition process
- How can you tell if the patient moved?
- Look at the raw data
- Place a point source or two on the patient (57Co). Did the source move?
- Sinograms and linograms help us in evaluate patient movement. If there is a interruption of the sinogram wave movement is usually the cause
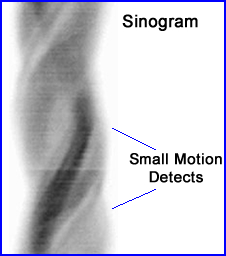
- This is an example of a cardiac exam showing minimal motion defects - reference
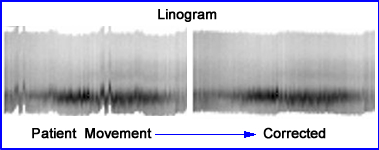
- Example of MPI study demonstration movement via linogram. Computer correction solves the problem - reference
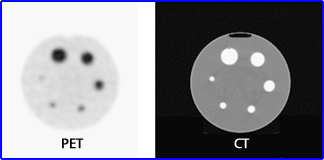
- Partial volume effect (PVE)
- Voxels in nuclear medicine have limitations via a 64 or 128 matrix. If the data that is acquired in voxel has more than one tissue type the count density would be incorrect
- If there is a variation in count densities then the average of both types of tissues is recorded, but the ability to see both tissues is impossible. This is an example of PVE
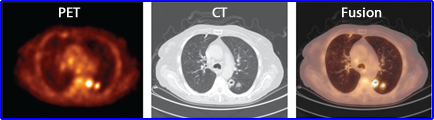
- In addition, from any dimensional direction activity from one voxel to another may "spillover" to adjacent voxel. This is apparent when you look at the above PET and CT data. In the PET image the hot spot appears to be attached to the wall of the thoracic cavity, however the CT image shows that the tumor is inside the lung
- Spillover can occur in any direction which reduces contrast and quantitative accuracy. Hence PVE is a concern
- In general, if the object of interest is less than 2x (or is it 3 - variation in literature) the system's FWHM, PVE occurs because the activity around the object "blends" with together. If the object is greater than x2, then a problem may occur at its edge since as the activity blends with surrounding media (see below)
- Furthermore, if objects contain the same amount of activity, but are of decreasing size, it appears that there is diminishing count density. This is seen above in the Jaszczak phantom (34, 28, 22,16,12, 10 mm). Why does CT display better resolution? Can there be PVE in CT or MRI? Refer to the article
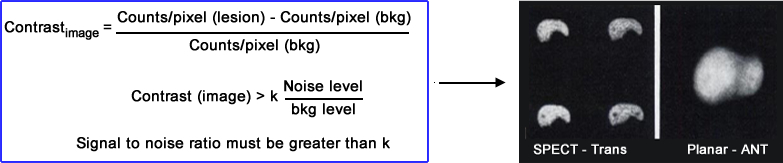
- Contrast (Planar vs. SPECT)
Imaging a cold lesion was assessed by RJ Jaszczak, et al. where 2 cold lesions where placed in a 3D liver phantom that contained activity. One sphere was 1.0 cm and placed in the left lobe while the other sphere (1.5 cm) was placed in the center of the right lobe
 Results:
- Planar had ~1,000k counts per image and SPECT had ~14k per slice
- The planar image contrast displayed both spheres with only an 8% target to BKG
- SPECT had a 32 to 54% target to BKG pending the location of the sphere
- Slices compared - transverse had a 34 to 54% and coronal had 31 to 47%
- Low target to BKG in the planar missed the lesion
- Note - FWHM for planar was 0.9 cm and SPECT was 1.3 cm
- What can we conclude from this? (Does contrast save the day for SPECT?)
Performance measurements in SPECT
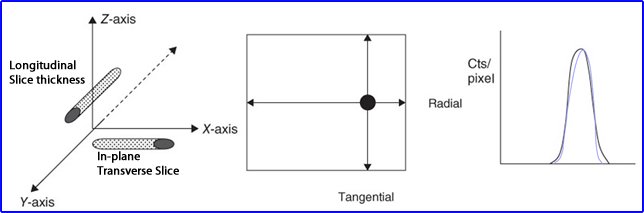
- Placing a line source in air or water media is acquired and then measured in different directions to determine its resolution
- In-plane measure and transverse slice resolution
- Cross-section of the line source is noted where tangential and radial profiles can be drawn to evaluate its count profile
- While longitudinal slice looks at the line source's thickness (in the Z dimension)
- Count profiles of to slices is displayed above
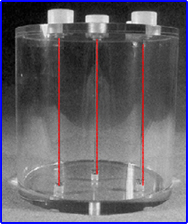
- Example of a NEMA SPECT triple line source phantom
- SPECT resolution
- SPECT is never as good as planar, in fact when we look at the numbers, SPECT is 15 to 8 mm where planar is 7 to 12 mm
- What causes the loss of spatial resolution?
- Object to detector distance
- Less counts means more noise
- Contrast resolution is what "saves" SPECT in its ability to pickup anatomy
- How can we increase SPECT sensitivity
- Increasing the amount of detector heads
- Use collimators that have good resolution, but improved sensitivity
- High photon flux with 99mTc based radiopharmaceuticals is preferred
How acquisitions parameters effect SPECT imaging
- Collimation
- While sensitivity and resolution are at issue with collimation choice, our focus must be on resolution
- High and ultra-high resolution - it is apparent that these are the collimators of choice
- Resolution is favored over counts. There is a 2 mm improvement with a better image quality when applying ultra-high resolution
- High resolution has poorer resolution even though counts increase by a factor of (HR) 3.4 when compared to 2.5 (UHR)
- Improving collimator resolution can be accomplished by either: increasing the septa length or reducing the diameter of its bore
- It is suggested that a SPECT systems should have 2 or more detectors when a ultra-high collimator being applied is used
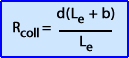
- Formula used to evaluate collimator resolution where: Rcoll = collimator resolution, Le - effective hole length, b - collimator to object distance, d - diameter hole
- Slant-hole
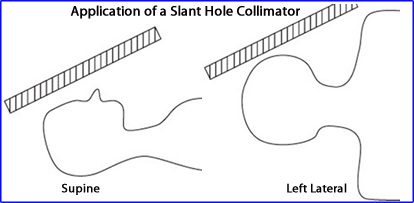
- This collimator applies a 30o caudal tilt since the septa are angled which allows the detector to clears the shoulders
- While you must apply the "right" angle to get the best result, literature indicates that there may be some variation
- Result - Significantly reduces the object to detector distance
- Focused (fan-beam and cone)
- Application preferred if the camera has a large FOV and the organ of interest is small (ex. heart)
- Via magnification, resolution is improved and sensitivity can increase by 50 to 100%
- To make this work the following criteria must be met
- Specific COR my be adhered to
- Extrinsic uniformity must be maintained
- Special reconstruction algorithm must be used with designated collimator
- Fan-beam issues
- Associates focal length with image magnification
- Must be apply circular orbit
- Energy window
- Twenty percent window is generally recommended and a more limited window would only reduce counts and increase noise
- If more than one energy peak is being emitted then use them all
- If you apply an asymmetry window to reduce scatter then make sure that your uniformity correction matrix has the same acquisition parameters
- Matrix size
- Size of the matrix
- Limited to our choices
- 64 or 128
- While the amount voxels increase by a factor of 4 when you select 128 over 64 there are several issues to contemplate
- Increasing the matrix size increases your noise by a factor of 3
- Larger matrix must be compensated by: increasing the dose administered and/or the acquisition time
- Linear sampling - relates to the amount of voxel available in the 3D image
- This highest sampling frequency must be at least x2 the size of the smallest object that can be resolved
- Hence spatial resolution is limited to this component. As an example, a 32 cm FOV with a 64 matrix can resolve down to 0.5 cm per pixel. The minimum size that could hypothetically be imaged is (x2) 1.0 cm
- If a 128 matrix would improve your resolution to 5 mm
- However, realistically requires us to take the calculate this value by a factor of 3 - as noted in a prior lecture
- Zoom
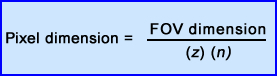
- Another way to improve your resolution is to pre-zoom the image prior to acquisition. The effect can be calculated by applying the above formula
- Where z is the zoom factor and n is the matrix dimension
- From the prior 128 matrix what happens to your resolving power if you magnify the image by a factor of 1.5? Answer = 1.67 mm
- Detector orbit
- Step-and -shoot is the most common method used in our profession. The camera stops and takes an image then moves to its next position, stops, acquires, etc..
- Continues mode is where the detector continuously rotates around the the patient.
- Usually several rotations around the patient is acquired
- Advantage - if the patient moves you may be able to remove one of the rotations and still salvage the study
- Disadvantage - it does increase the amount of blurring which usually occurs in the tangential direction
- What type of orbit should you apply? Circular, elliptical, or body contour - refer to prior lecture
- Body contouring may improve image resolution by as much of 2.5 mm when compared to a circular orbit
- If a laser is used to the contour the body make sure there are no interfering objects extended from the patient or imaging table
- Some systems allow you to magnify the image and it keep the area of interest centered in each step of acquisition
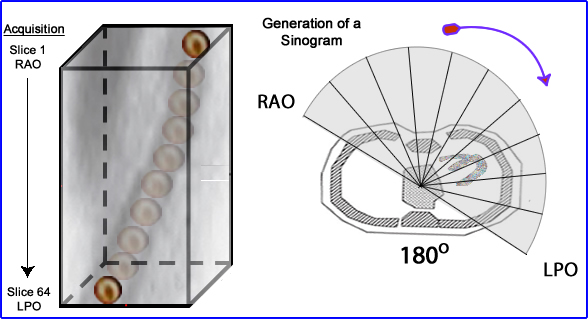
- 360 vs 180 rotation
- Radon's original theory (Radon transform) indicates the need to acquire data 360 degrees around the area of interest, however, in cardiac image most clinics acquire 180 degrees worth of data. Advantage/Disadvantage
- Myocardium location on the left side of the body means that images, such as RPO projections are too far away to give relevant data
- 180 degree acquisitions allows for more counts reducing noise
- 180 degree fails to acquire appropriate data of the posterior wall of the heart
- Posterior wall issue is of greater magnitude with 201Tl
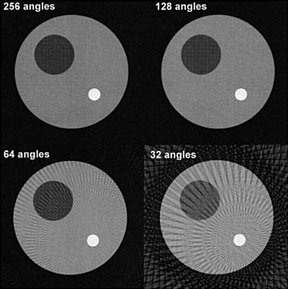
- Angular sampling
- The amount of stops during acquisition will effect image quality which was also discussed in a prior lecture (this includes the concept of aliasing)
- Radon theory identifies that a infinite number of projections around an object will yield a "prefect replication"
- Technically the fewer amount of stops around an object reduces counts and increases noise
- Too few stops results in streaking artifacts
- In FBP, the more stops you have the greater amount of BKG caused by the backprojections rays - What can be done to remove this excessive BKG?
- So how many stops is enough? Base it an the matrix number 64 = 64 slices and matrix number 128 = 128 slices
- Time per stop
- Increasing time reduces noise but increases the possibility of patient motion. So how do you reduce motion?
- Make the a patient as comfortable as possible - How?
- Explain the procedure to the patient and emphasize the need not to move
- Limit the acquisition time when ever possible
- Image with more than 1 detector head
Techniques to improve image quality post acquisition - Reconstruction process
- Weighting factors
- Low-frequencies filters will roll-off excessive noise found at the high frequency level (apply low weight factor)
- High-frequency filters will remove blurring and BKG caused by backprojections (apply high weight factor)
- Middle frequencies contains most of your true counts
- Reducing the critical frequency removes graininess
- And set the high frequency to 0.5 cycles/pixel - remember NF
- Butterworth filtered reviewed - Order, critical frequency, cut-off
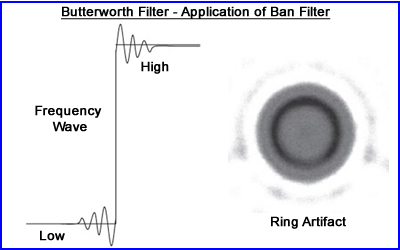
- To better define the edge of the object one might apply a Butterworth filter in such a manner where
- The roll-off of the low frequency reaches zero on the x-axis just pass the NF range - generating aliasing artifact
- This sharp contrast creates a ring artifact referred to as he Gibbs phenomenon
- The above image is a cylindrical phantom with hot sphere located within the water medium
- Therefore to eliminate this a more gradual adjustment of the filters are recommended and keep the frequency within the NF
- Iterative reconstruction - what can you manipulate
- More limited than FBP
- Number of iterations
- Apply post reconstruction filter to reduce noise
- Process does a better job with reduces scatter with attenuation correction
- Improves depth-dependent reducing resolution loss
Return to the Table of Content
3/22
Reference
Partial-Volume Effect in PET Tumor Imaging by M Soret, SL Bacharach, and I Buvat, Society of Nuclear Medicine, JNM, vol, 48#6 (2007)
Visual Quality Control Of Gated Myocardial Perfusion SPECT by JM Wheat, GM Currie, B Ramsay, Internet Journal to Cardiology