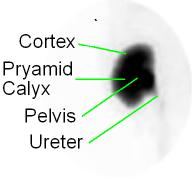
- First, blood flow to the kidneys - this can simply be seen visually, but it can also be quantified
- Second, function of renal parenchyma can be analyzed quantitatively - identifying cortical, regional, or global disorders
- Third, urinary drainage can be visualized or analyzed quantitatively (EI)
- Limited resolution (usually can see disordered [lesions] to about 1 cm)
- Unable to differentiate between tumors, cysts, and scars
- Cannot image stones or calcification
- MRI maybe the best choice of identifying many types of renal disease, however, nuclear medicine can complement a diagnosis as well as determine renal function
- Upright imaging is preferred, especially when considering an obstructive uropathy
- Patient needs to be well hydrated unless contraindicated
- 10 mL/kg of water or juice 30 minutes prior to the study is suggested on all renograms
- Start IV of saline or dextrose/saline, 100-500 mL 30 minutes prior to the study
- Use of a Foley catheter maybe suggested - remember the patient has to stay on the imaging table for about 30 minutes. Additionally, if EI is going to be acquired then you must use a Foley!
- Full bladder my induce retention of the radiopharmaceutical falsely, indicating obstruction
- The same maybe said when diagnosing renal vascular hypertension (RVH) in which a full bladder may falsely effect cortical transit time
- Collimator - LEHR
- Matrix size - 256
- Camera/computer setting
- Phase I (flow phase or dynamic)
- 1 Second/frame
- For 60 seconds
- Phase II (tissue-function drainage or cortical transit)
- 30 seconds per frame
- 21 minutes of acquisition
- Phase III (drainage or excretory)
- Patient should empty his/her bladder
- Take an additional 1 minute image
- If activity remains in the kidneys or activity is seen in the ureters, then an additional image maybe required at 1-2 hours post injection
- At 20 minutes post MAG3, in a normal renogram, in a well hydrated patient, normal emptying should be noted with only a slight amount of activity remaining in the kidneys
- Most clinics inject Furosemide around 10 to 20 minutes post administration of MAG3
- Sfakianakis, et. al. recommends that Furosemide be given at the time of the MAG3 injection. It should be noted that Furosemide does not affect or change function of the MAG3 injection. However, it does prevent any possible questions that would result from tracer retention in the renal pelvis that would be an indication of blockage
- Furosemide dose = 1 mg/kg with a maximum of 40 mg. In cases with known renal insufficiency 80 mg maybe given
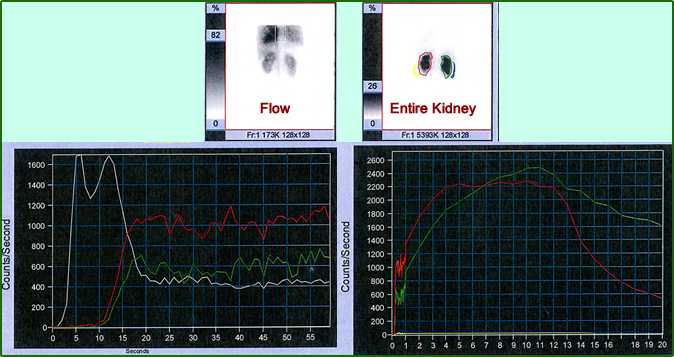
- Many software programs split the renogram curve into two sections creating to separate renogram curves: the flow phase (1 second per image) and the Tissue-function drainage phase (30 second per image)
- Process for drawing the ROIs in the flow study is noted above
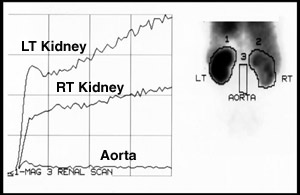
- ROIs are drawn around the right kidney, left kidney, and aorta.
- Curve is generated to show initial uptake of the kidneys
- Left and right kidney increase with activity as the radiopharmaceutical is extracted from the blood stream
- Aorta initially shows a slight increase in activity and then flattens out
- Determination of Flow Velocity Index (FVI) may be calculated
- Ratio of the slope of the kidney over the slope of the aorta
- Normal values should be 0.8 to 0.9
- Most useful in renal transplants
- Excessive aorta activity resulting in a value of < 0.8 is an indication of poor renal function
- Quantifying of Cortical Transit Time
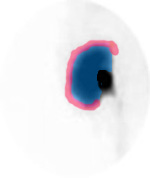
- Drawing your region of interest (ROI) around the kidney
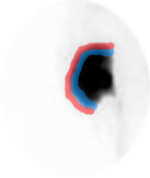
- From the images above note the labeling and location of the ROIs drawn. A thin "C" is drawn around the renal cortex (blue). Outside the cortex a background count is generated by drawing another "C" outside the cortex (red)
- Each ROI should be no more than 2 pixel thickness
- Why should the cortical ROI be so thin?
- In order to evaluate all the data, the flow study is summed to 2-30 second images and combined with 42 images (So that all images are 30 seconds in length)
- Cortical transit time must be evaluated, sometimes referred to the cortical renogram. This is useful in determining cortical diffuse disease. Refer to the above images
- Residual cortical activity(RCA)
- Determine the amount activity remaining in the cortical region at 20 minutes post injection
- RCA = (Cortical counts at 20 minutes/cortical counts at peak) x 100
- Normal should be <20%
- Original cortical activity(OCA)
- Evaluates cortical activity at 2.5 minutes and 20 post injection
- A ratio is generated
- Poor renal function if the value is <3
- Rate of accumulation (AI)2
- Cortical counts/BKG counts at 1 - 2 minutes
- This ratio should have a rather high value to be normal
- Exact range not given
- Quantification of overall renal function
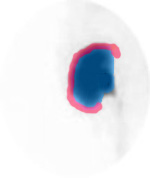
- Global Renal Function(see above image)
- ROI is drawn around the entire kidney at 1-2 minutes post injection, excluding the renal pelvis (black)
- Background is drawn around the outside of the kidney (red)
- (Total kidney counts - BKG/Total counts kidney) x 100 = 90 to 95%
- Less than 90% is considered abnormal
- What clinical information is lacking from this calculation?
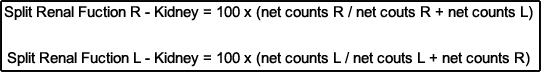
- Split Renal Function
- Compares the function of one kidney to the other and is useful in evaluating nephrectomy, prior to therapeutic intervention to the kidneys, or when unilateral disease is present
- Using MAG3 or DTPA activity of both kidneys are evaluated between 1-2 minutes post injection
- ROIs must be drawn prior any activity being seen in the ureters (why is this a concern?)
- ROIs drawn for this analysis is the same as the one drawn for global renal function.
- Applying background substation to determine the net activity of each kidneys and calculate their difference using the following formulas
- This approach may also be used with DMSA and is calculated on the delayed images
- What information does this calculation give you? Not give you?
- Diuretic renogram
- Dilation of the kidneys drainage system (ureters) occur when they are obstruction
- This causes hydronephrosis (water inside the kidney) causing a dilated renal pelvis and hydroureter as the body response to an obstruction
- Dilation may also be present without obstruction

- In general a dilated intra-renal drainage system is associated with parenchymal thinning. The extent of thinning usually depends on how long there has been a blockage. FYI - Urinary reflux from the bladder can cause the same "thinning" defect. Thinning is associated with a loss of cortical function
- With complete obstruction, urinary flow stops. In a time activity curve cortical activity portion of the curve will continue to raise and never ever enter an excretion phase
- In partial obstruction, there is delayed filling in the renal pelvis and the radio urine "hangs up" in the collecting system. Pending the degree of partial obstruction, some activity is released slowly into the ureter, with a time-activity curve showing a slight down slope over time
- Obstruction maybe chronic or acute. In the acute phase there may be no dilation in the ureters
- Characteristics of obstruction may include (pending severity of the obstruction):
- Decrease in renal blood flow/uptake
- Decreased cortical transit time
- Retention of activity in the cortex and renal pelvis
- All aspects of the time-activity will be delayed and the excretory phase portion of the curve may never be seen
- One other factor to consider is there any activity urine being produced
- Assessing obstruction - Diuretic Renal Scintigraphy
- Lasix maybe administered 15 minutes prior to the nuclear procedure, at the same time that the radiopharmaceutical is administered, or 20 minutes post injection
- Recommend that the diuretic be given at the same time the radiopharmaceutical is administered
- Foley catheter is not recommended but is patient dependent
- Patient should be well hydrated prior to the radiopharmaceutical administration. See prior discussion on patient hydration
- See above for Furosemide dose
- Procedure and quantitative analysis of the kidney would be the same as mentioned above, however, the ROIs for global renal function should be drawn as indicated in the diagram. Note - blue ROI is drawn around the entire renal collecting system (to include the renal pelvis)
- Results - Depending on when the Lasix is injection, post administration if the T1/2 of the time activity curve is less than 10 minutes then there is no obstruction. Between 10 to 20 minutes obstruction there may be partial obstruction and greater than 20 minutes is positive for obstruction.1
- Comparing two different processing formats and how it effects on the time-activity curve
- In the first attempt in setting the ROIs the entire kidney is is included. On the left is the bolus 1 second injection and on the right are the first 20 minutes of data collection. Notice the cortical transit time is extremely extended. What are the T1/2s for the right and left kidneys? Are they abnormal?
- The second set of ROIs are drawn in for cortical function, but are they truly cortical? At least the renal pelvis is excluded. In comparison to the prior set of images, what happens to cortical transit? Does the T1/2 improve?
- The lesson hear is to appreciate how the change in the ROIs may significantly alter your results
- At VCUHS both types of processing are done to see (1) how well is the cortex functioning (2) How well is the urine be excreted

- Renal artery stenosis (RAS) and the application of renal scintigraphy
- While some aspects of RAS have already been discussed further detail needs to be addressed
- At issue is the effects RAS on the renal blood supply, which results in RVH
- Renin-Angiotensin System and the application of the ACE inhibitor
- ACE inhibitors include: Captopril, Aprilette, trilateral, and eosinophil (there are others and all generic names end with "peril")
- When this ACE inhibitor is applied the alteration within the hemodynamics of of the nephron causing a delay in cortical transit and excretion
- It is suggested that a baseline exam be completed prior to an ACE-I scintigraphy procedure
- Sensitivity and specificity is greater than 90%
- ACE-I Renogram
- The patient must be well hydrated
- Baseline exam (1 day protocol)
- Inject IV 1 mCi of 99mTc-MAG3
- Complete acquisition as described in the renogram protocol
- Process and identify: FVI, RCA , OCA, and Global renal function
- Ten minutes after the baseline exam administer 2.5 mg IV of enalaprilat (Vasotec) or 25 to 50 mg of captopril PO (pill must be crushed and diluted in water)
- Ten minutes post administration of Vasotec (or 1 hour post administration of captopril) administer 20 mg of furosemide along with 9 mCi of 99mTc-MAG3
- Warning: Occasionally administration of an ACE inhibitor will cause a vasovagal response. For this reason the patient should have his/her BP monitored multiple times prior to renogram procedure
- Follow imaging protocol as stated for a renogram
- Process and re-identify: FVI, RCA , OCA, and Global renal function
- An RCA of >20% is considered abnormal or if the RCA increases by 10% from baseline
- Alternative method (2-day protocol)
- Using the same above criteria administer the ACE inhibitor and inject 10 mCi of 99mTc-MAG3
- If the RCA is abnormal, the patient should be brought back 3 days later to determine his/her baseline (10 mCi of 99mTc-MAG3 will be used instead of 1 mCi)
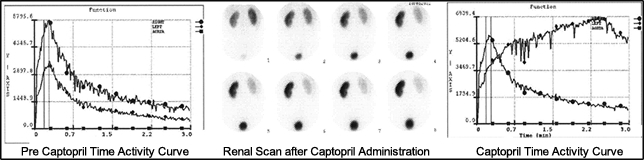
- The above image and graphs are an example of a patient that had severe left renal artery stenosis. In fact, the pre-captopril shows reduced uptake of the left kidney, however, the overall curve appears somewhat normal. Following captopril administration there is significant loss of activity seen in the renal scan. When quantified the time activity curve further confirms stenosis with significant delay seen in all three phases.
- Evaluation of renal parenchyma for acute pyelonephritis (APN) and other diseases
- APN causes scarring of the renal parenchyma
- The use of 99mTc-DMSA for high resolution of the renal parenchyma is suggested
- Procedure is 90% sensitive and specific whereas, IVP and sonography range is <50%
- Protocol
- Inject IV 5 mCi of 99mTc-DMSA
- Delayed imaging should start 3 hours post dose
- Planar imaging maybe accomplished with a LEHR
- 500k imagines
- 256 matrix
- Planar imaging with pinhole collimation may be considered
- 100k images
- 256 matrix
- SPECT imaging maybe considered
- 30-50 second per stop
- 64 or 128 stops
- 360 degree acquisition
- 64 or 128 matrix
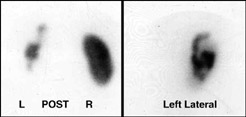
- The above image is an example of an acquired DMSA Scan
- Note the lack of activity in the left kidney - This is polycystic disease
- SPECT-MAG3
- Inject 20 mCi of 99mTc-MAG3
- Follow with an immediate injection of furosemide
- Fast SPECT acquisition must be completed in 4 minutes
- Additional information maybe obtained by completing a static image at 20 minutes post injection of the tracer for RCA analysis
- In addition, urinary drainage information maybe obtained at 20 minutes post tracer injection

http://jnm.snmjournals.org/content/44/10/1574/F3.expansion.html
Return to the beginning of the document
Return to the Table of Contents
6/23