Renogram Curves
- General
- There are three portions to a renogram curve
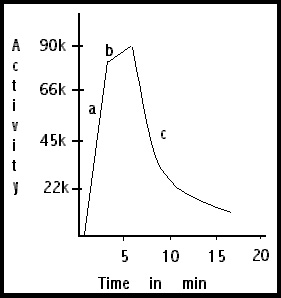
- A - Vascular (flow phase) - Shows blood flow and initial uptake
- B - Cortical transit (tissue-function phase) - Peaks at 3-5 minutes
- C - Excretory (drainage phase) - T1/2 should be less than 10 minutes
- Time per phase is important in assessing normal/abnormal renal function
- Delay in any part of the curve indicates a problem with that aspect of the kidney
- Vascular
- What would cause delayed uptake?
- What would cause little or no activity?
- Cortical transit
- What would cause the curve to have an extended cortical transit time?
- What would cause the curve never to have a peak?

- Components that affect this phase - a variation of cortical transit time is noted with different radiopharmaceuticals. Other aspects that would effect cortical transit would include: age, renal transplant, and dehydration
- Excretory phase
- What would cause an extended T1/2 or no T1/2?
- What should be administered to confirm disease?
- What would cause a delay in all three aspects of the curve?
- A look at some curves
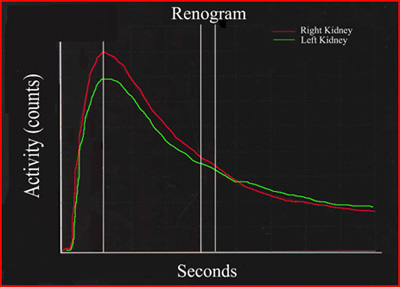
- First, let us look at a normal curve (above)
- There is a short vascular phase
- Cortical transit that lasts no more than several minutes
- The T1/2 of both Rt and Lt kidneys occur within 10 minutes
- The next example considers renal obstruction and the concern is to determine when a complete or partial obstruction may be present
- Blue line represents a normal time-activity curve of the kidneys
- Following the red line to determine obstruction.
- When lasix is given does the slope turn negative or stays positive?
- Click here if you need see the difference between a positive and negative slope
- Following the orange lines where the T1/2 is less than 10 minutes (total 30 minutes) then there is no obstruction
- However, if the T1/2 is between 10 to 20 minutes (total 30 to 40 minutes) then there is partial objection
- If the red line continues a positive slope, then there is total obstruction
- Here is an actual time-activity curve that shows total obstruction. Note that even after Lasix is administered the curve continues to build
- Example of what a hydroureter (ureter blockage) looks like. The above is a similar example from the previous curve showing no cortical transit or excretion phase
- The above is an example of ATN following a renal transplant. There is no clear definition of cortical transit or excretion phase.
-
The above is an example of renal nephrectomy or a non-functioning kidney.

- What does a time activity-curve look like as the kidney continues to fail over time? Several key points you should note
- As renal failure continues all three phases of the time-activity curve are extended.
- Purple goes to brown goes to red in the different curves are an example of the kidneys progressively getting worse.
- Red also indicates total obstruction
- Blackline indicates total renal failure
- Three more examples of renal curves and the related images. What are your thoughts as to what might be going right/wrong?

- Compare the role of lasix and relate this to renal obstruction

- Can you tell the effects of an Ace Inhibitor?

- Assess the curves. Compare the right kidney to the left.
Return to the beginning of the document
Return to the Table of Contents
6/22