
Entering and Manipulating Data
Overview
In its most basic form, a spreadsheet consists of an orderly way to store data (either numeric or text) in tabular form. This data can then be processed by other programs, most of which are capable of reading the Excel format. For instance, word processing programs such as Word can use Excel data to perform mail merges. SPSS can read Excel data and generate sophisticated statistical analyses. Database programs such as Access can interpret the table rows and columns as records and fields and process queries and generate reports. It turns out that many of these functions can also be done directly from within Excel, but first we need to get the data in there.
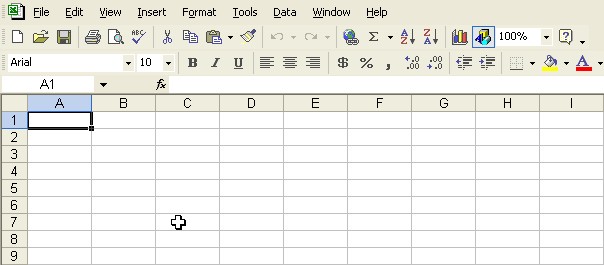
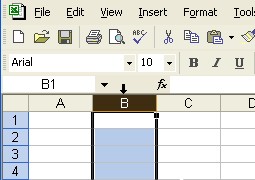
Typically, you will see something like the above when you start up Excel.
The rectangular grid is where the data is stored according to rows (numbers) and columns (letters). Each cell in the table has an address, given by the letter of the column followed by the number of the row. For instance, the cursor is the fat, white "+" hovering in cell C7. The cell that is currently selected (highlighted with a bold border around it and with the corresponding row and column shaded in blue) is A1. The address of the currently selected cell is displayed in the box on the left immediately above the table.
Entering Data
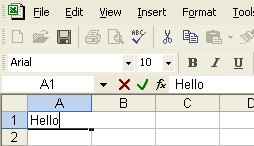
To select a cell, merely move the cursor to it and click.
 Once
you start typing, the cursor will change to a vertical bar and your data
will appear in the selected cell. It will also appear in the other white
box immediately above the table (referred to as the "formula bar").
You may edit the data in either location.
Once
you start typing, the cursor will change to a vertical bar and your data
will appear in the selected cell. It will also appear in the other white
box immediately above the table (referred to as the "formula bar").
You may edit the data in either location.
You may also notice two other symbols appeared, a red "x" and a green check mark. These are only displayed while you are editing. Clicking on the "x" is a way to cancel whatever it is you are entering (as will pressing the ESC key). Clicking on the check is a way to finalize the data you are entering (same effect as pressing the ENTER key).
Different Data Formats
Depending upon what you type in, Excel will treat the data differently. For example, if you include any alphabetic characters, it assumes you are entering text and left justifies it. If you type in numeric data (digits, decimal point, leading +/-) it will treat it as a number by right justifying and trimming unnecessary 0's.
 |
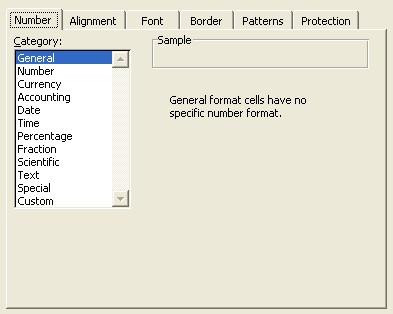 |
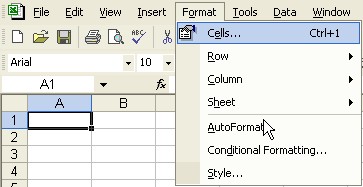
Even trickier, if you include such things as a "$", a "%", an "e", a "/", or a ":" in a number, Excel will automatically format it as one of the special types above (Currency, Percentage, Scientific, Date, and Time respectively). This wouldn't be so bad, but if you go back and try to put some other number in the same place, it will continue to treat it the same way. This is especially annoying when you try to enter a fraction using a "/" and it gets treated as a date. To fix this you need to go to the Format menu (shown above left) and click on the Cells option (above right) then manually reformat the number category to the correct type.
There is a variety of other formatting that can be applied to your data, primarily for the purpose of appearance: colors, fonts, styles, etc. Also you can modify the background of the cell itself, giving it color and different types of border.
Drag and Drop
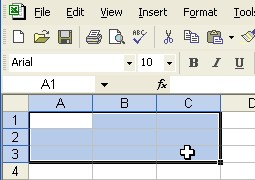
Occasionally it is useful to move your data around. This generally entails highlighting a block of cells (or entire rows or columns) and dragging it somewhere else. This requires a certain amount of care with the mouse. To select an entire row or column merely click on the row or column header (the number or letter at the start of each row or column). The cursor will turn into a black arrow as it hovers over a header. To select a block of cells, click down with the white "+" cursor in the upper left of the desired section and drag down to the lower right.
 |
 |
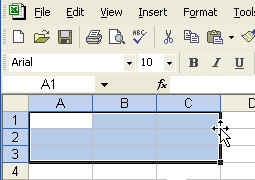 |
Once the region is highlighted as shown above you may then click on the bold border (a four-sided arrow will appear) and drag the entire block to wherever you want it before letting go.
Auto Fill
The other useful basic manipulation that you can perform is the auto fill operation. This is where Excel takes the data in one cell (or several) and tries to project what you want in other cells in the same row or column. This is extremely powerful when we start working with formulas, but it can also be handy for simple numeric values. First, it can be used to duplicate data, sort of like a quick copy and paste.
 |
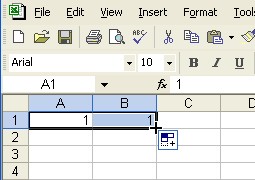 |
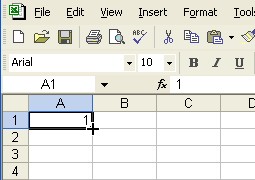
If you select a single cell you will notice a small black square in the lower right corner, called the "fill handle". When the cursor hovers over this it becoms a black "+", indicating that it is ready to fill. Clicking on the handle and dragging either horizontally or vertically will have the effect of duplicating the value in the original cell over the range that you select.
 |
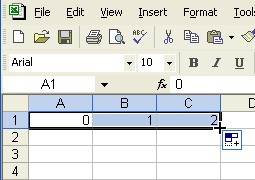 |
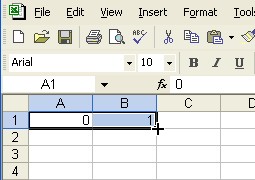
When you select multiple cells (the results are more predictable when it is only two) and perform the same auto fill operation, if the cells have different values, Excel will attempt to predict the trend and generate new values accordingly. The numbers will progress as an arithmetic series, with the same spacing between any two adjacent values. This latter turns out to be very useful when producing a column of increasing numbers to use as x coordinates when plotting a function.
Some Sample Exercises
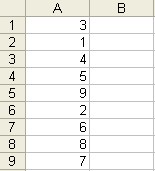
- Enter the following data. Using the drag and drop procedure above,
rearrange the numbers so they are in order. How many operations did
it take (remember, you can move more than one cell at a time, but unless
you plan to wipe out some of your data, you must move it to an empty
region)?
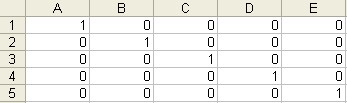
- To create what is referred to as the "identity matrix" you
need to have a square block of cells filled with 0's, except for the
diagonal of the block, which is all 1's. Although it is still generally
faster to type in the 1's by hand, you can easily generate all the 0's
by typing in a single zero and performing two auto fill operations.
See if you can efficiently create the following matrix.
- By typing in two numbers and performing an autofill operation, can you generate a column of numbers that goes from 0 to 10? Now, by changing one number and performing another autofill can you make your column go from 0 to 50 by increments of 5? Go from 0 to 1 by increments of 0.1?
Contact Leo Wibberly at ldwibber@vcu.edu or (804) 740-4650 to make appointments