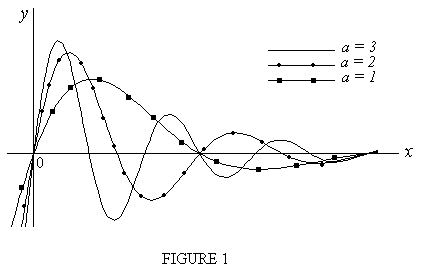
and use the scrollbar to examine the shape of the function as the parameter a ranges betweem 1 and 3. Plot the graphs for the three values a = 1,2,3 in the same coordinate system. Decide on good ranges of values for x,y.
Click here for the .dpg file containing the needed commands. When this file opens on your screen, click the "Scrollbar" on the top menu (or press [alt][r]) and then click "A variable" for the parameter a (the two "a"s need not be the same; we might have sin(kx) for example, but enter "a" in the graph3d(...) command instead of "k"). The starting value of a in the scrollbar is 3, so lower it towards 1 and observe what happens to the curve. Note the following:
You may change the range of a by clicking "Edit" (or pressing [alt][e]) and then changing the values for one or both of "a.maximum" or "a.minimum".
To enter axes, add the two equations x = 0 (the y-axis) and y = 0 (the x-axis) in the graph3(...) command. Refer to the .dpg file for the correct syntax.
The range of values for x and y as seen in the "Edit" dialog box (under commands "graph3d.minimumx", etc.) seem to give a good sense of the graph and its oscillatory and decaying character. The range for "z" is chosen so that the third dimension is too thin to be seen (this is a two dimensional problem).
Figure 1 below shows the graphs for a = 1,2,3 in the same coordinate system. See the "software" page for hints on how to create multiple plots using MS Paint.