BACKGROUND FOR RELATIONAL DIAGRAMS IN SYSTEMS DESCRIPTION
Fellow ISCE
A --> [BLACK BOX] -->B
The usual mathematical symbolism for this is called a “mapping” of A to B (meaning from one collection A to another B) by and agent, f, namely the agent in the black box responsible for the transformation.
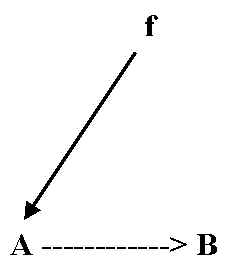
f
A à B
or
f: A à B.
Robert Rosen tied this representation to a causal semantics involving the material and efficient causes of the transformation. The material cause of B in this situation is merely A. The efficient cause of B is the mapping itself, f. Thus we encode a functional description of the system as follows:
Now we see the mapping f as being the efficient cause of the transition from A to B. This notation accomplishes something that is not trivial. The ability to represent mappings which mix these two causalities allows the embodiment of function as “something” in the system and this is the something that makes the whole more than the mere sum of its parts. This function is context dependent and usually can not be mapped 1:1 to the structural aspects of the system.