Fractals, Fractal Geometry & Chaos: Some Limits on Empiricism
The fractal dimension
How long is the cost of Virginia? You are probably wondering if anyone has
"measured" it. (Assuming you have the usual, blind trust in measurement
characteristic That a deep-seated belief in empiricism as the only way to know). The
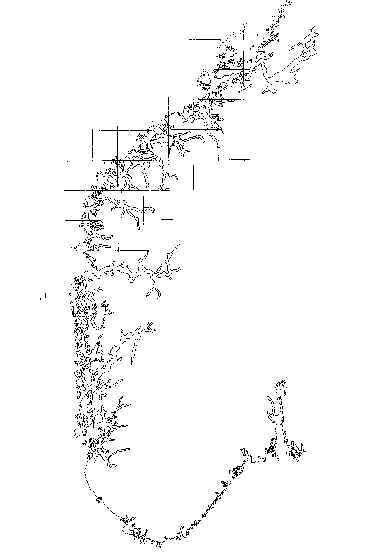
figure above is a picture of part of the coastline of Norway. The map has a superimposed
grid . The number of such squares necessary to cover the coastline is roughly equivalent
to the number of steps with a divider of opening of which you would take measuring the
length of the coastline. By decreasing the size of the grid, s, a more high resolution
measurement can be achieved. The number of steps with the divider, or the number of
squares, N(s), should be inversely proportional to the
size of the grid, s. One would anticipate that then length
of the coastline approaches a constant, LN, as s
shrinks. Unfortunately, this is not the case! The next figure shows the outcome of
this exercise. The log-log plot indicates that the coastline's length always seems
to depend on the resolving power of the measurer. 
Ha! You say. This is because the coastline of Norway is so jagged. O.K. Look at the
figure below. Not so uncommon a phenomenon, right? Incidentally, the circle is interesting
as the exception that proves the rule.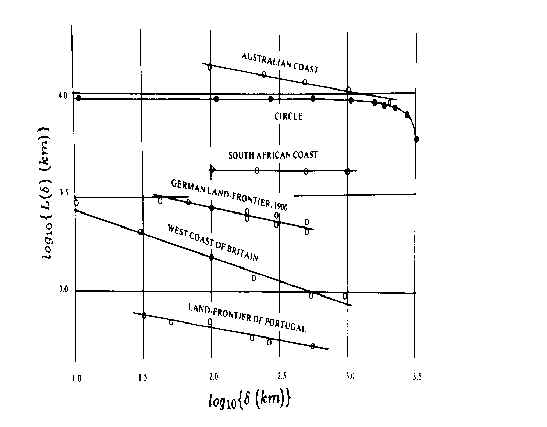
Coastline length as a function of "yardstick length"
A Model: The Triadic Koch Curve
The following simple fractal model will serve two purposes. First, it will allow us to illustrate as cleanly and simply as possible what is meant by a fractal. The Koch curve is a self-similar object created by a simple recipe.
The second is more esoteric. A bit of math is shown to illustrate the notion of fractal dimension in a manner that gives it a rigorous definition. You can take it or leave it, but at least know that it can be done. What is more fun is that it is not an integer! Once again our traditional concepts get shaken a bit.
Let us use a model to see what is happening. The figure above illustrates the steps in constructing a triadic Koch curve. The procedure is simple. Start with a line segment and call its length l. (You can even name this unit after yourself.) This is the initiator and it can be replaced by any polygon. The construction proceeds as follows:
Using the initiator as the 0-th generation of the Koch curve, we replace each segment of unit length by the 1st generation which is a curve of 4 line segments, each of length 1/3. The length of the curve is now L(1/3) = 4/3.The next generation is obtained by replacing each line segment by a scaled-down version of the generator. This results in N = 42 = 16 segments of length s = 1/3 x 1/3 = 1/9 and the length of the second-generation curve is L(1/9) = (4/3)2 = 16/9. To go on indefinitely, we recognize that L(s) = (4/3)n and s = (1/3)n so that by taking the natural logarithm of both sides of the equation we get ln s = - n ln 3 or n = - ln s/ln 3.The Length is L(s) = (4/3)n = exp { -ln s [ln 4 - ln 3]/ln 3}. (Can you figure out the mathematical trick here? Remember that (4/3)n = exp{n [ln 4 – ln 3]} ). We define the fractal dimension, D, as D = ln 4/ln 3 ~ 1.2628. Then the length is L(s) = s(1-D). The number of segments is N(s) = 4n = 4-lns/ln3 = s-D. The length of the curve diverges and s tends to zero as the number of generations increases. By some rather involved topological reasoning, this fractal dimension exceeds the topological dimension, which mathematically establishes the Koch curve as a fractal set.
Self Similarity
One characteristic approximated by coastlines and true of the Koch curve is self-similarity. No matter how strong the magnifying glass, you see roughly the same pattern.
The next figure shows the Sierpinski carpet. Its fractal dimension is D=lns/ln3=1.89.

Fractals and Chaos:
The relation between fractal geometry and chaotic dynamics is an intimate one. If you can imagine a nice, flat 2-D space in which the phase portrait of a linear system constitutes an oval, and then imagine that, among other things, as the system becomes nonlinear its phase portrait "folds up" in peculiar ways, you begin to get the picture.
This portrayal of the strange attractors "home" can be arrived at in a number of different ways. One has to do with plotting the fate of the dynamics in the phase portrait with different colors corresponding to the different outcomes. The fractals associated with the Julia set and others are of this nature.
Another way of discerning the fractal geometry of strange attractors is the cross section of the attractor. Such sections yield patterns that can be identified as a Cantor set. The method involves looking at a cross section of a disc containing the strange attractor lines. This section is known as a Poincaré section. The details of how such things are done are beyond our scope here. The bottom line is that chaos is a very ordered thing.
Reference: FRACTALS, by Jens Feder, Plenum Press, N. Y., 1988 ISBN 0-306-42851-2