The Analysis Pulse-Height Spectrometry
- Pulse-Height spectrometry examines the amplitudes of signals being received from the detector which arrive at the PHA to be accepted/rejected
- Description of how energy is transferred in a Na(I) crystal. Several assumptions must be made: γ is less than 1.02 MeV; interactions will be at the photoelectric and Compton scatter levels.
- When photoelectric interaction occurs usually all of the γ energy is absorbed
- Pulse-heights are generated from photoelectric interaction within the crystal that creates a pulse heights that are proportional to energy deposited in the crystal
- Ideally this produces a single narrow line in the pulse height spectrum, defined as the photopeak
- When Compton scatter occurs, only part of the energy is deposited in the crystal, that which is absorbed by the deflected electron
- Photopeak created by this interaction is less than the photopeak generated from the photoelectric effect (note the Compton region in the graph below)
- A second gamma ray is produced which is absorbed by the crystal and this will also create a photopeak significantly less than the peak generated from the photoelectric effect (again note the Compton region below)
- All Compton interactions will generated photopeaks below the photopeak generated from the photoelectric effect
- Energy deposited, from Compton, depends on the defection of the gamma ray, with a 180 degree defection being the maximum
- This results in other parts of the energy spectrum (note diagram)
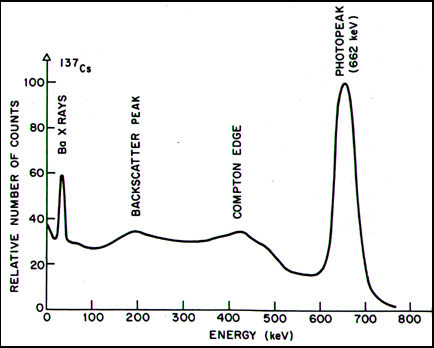
- Note the parts of this typical gamma spectrum of 137Cs
- Compton region - is the area before the photopeak
- Compton plateau - is the area just before the Compton edge
- Compton edge - is the area just before the Compton valley
- Compton valley - is the area/valley just before the photopeak
- Ba x-ray peak - is emitted by 137Cs atom
- Photoelectric peak - is the energy of the radionuclide that needs to be recorded
- Note the photoelectric peak is looks like Poisson distribution curve and it is not a straight sharp line and the Compton edge is rounded. This is due to the imperfection of the energy resolution of the crystal
- Backscatter peak (note image above) is a result of γ interaction with the detector shielding at 180 degrees. Lower energy γ is then deflected back to the crystal and the lower energy is detected
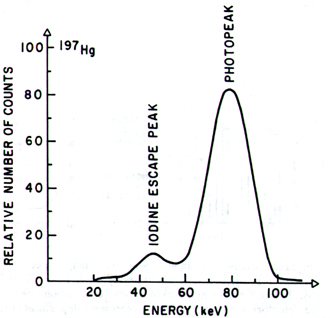
- The iodine peak is a result of photoelectric absorptions interaction with the iodine atoms in the crystal followed by the escape of characteristic Iodine K-x ray at 30 keV
- Usually occurs with lower energy γ's (think about imaging radionuclides that have a lower energy)
- With lower energies the interaction usually occurs at the beginning of the crystal (where the gamma ray enters the crystal)
- As higher energy γ's are utilized, energy absorption occur deeper in the crystal and the above iodine escape peak is less likely to occur
- However, if it does the energies between the escape peak and photoelectric peak are closer together making the peaks more difficult to distinguish
- Lead x-ray peak can also be seen when because of lead shielding in the detector and in the collimator - Results from photoelectric interaction with the lead causes characteristic x-rays being emitted and then the crystal absorbing its x-ray in the 80-90 keV range
- What type of spectrum is generated is the γ energy is greater than 1.02 MeV?
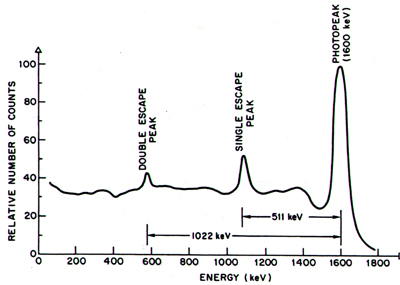
- (The following spectrum results above) Pair production results and when the positron comes to rest mass it annihilates with an electron and produces two 511 keV γs
- If only one gamma is absorbed by the crystal then a single escape peak is recorded
- If both gammas are recorded then the double escape peak can be noted
- Result of scatter within and/or around the radiation source (ex. inside the patient)
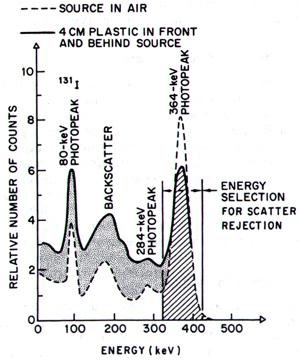
- Between the dotted and shaded area in the above spectrum is what is known as scatter within the patient. Below the dotted line is the actual spectrum without scatter
- Notices that the LLD and ULD are place in the correct position which eliminates most of the scatter
- WAM is a method recommend by one of the camera companies. The suggestion is to shift the LLD and ULD slightly to the right. What do you think happens to your count rate and image resolution if this technique is used?
- Coincidence summing occurs when there are two or more gamma peaks being emitted by the radionuclide
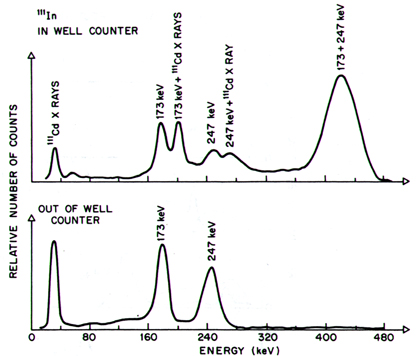
- Summing occurs usually within a well counter where both 173 and 247 keV peaks are recorded as a single photopeak
- There is less likelihood for this to happen when these gamma rays are detected in vivo
- The effects of different energy gammas with regards to the actual energy peak and scatter (there are two general effects: Compton vs. the photopeak)
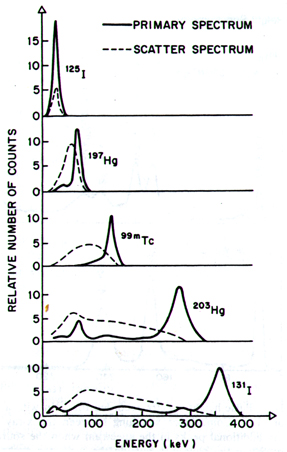
- In lower energy gammas, such as I125, Compton region becomes larger as the energy peak increases
- It becomes easier to separate Compton from the actual peak as the energy gamma increases
- Compare Tl-201 to Tc99m and discuss the scatter problem
- Note: Scatter is a result of gamma rays interacting with different tissues within the body
- What happens to the photopeak as crystal size increases?
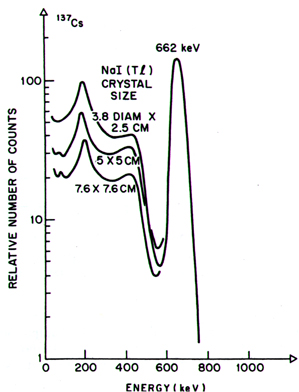
- The greater the crystal size results in a greater efficiency in absorbing the actual photopeak as well as Compton scatter
- Peak increases with increased crystal size
- Compton increases with increased crystal size
- Effects of increased counting rates
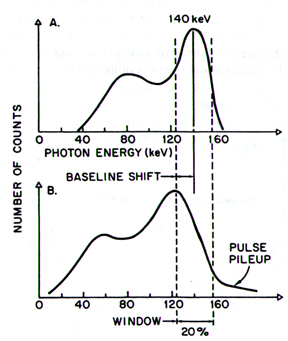
- The first of two diagrams represent the counting of a normal or low count rates (everything looks normal)
- However, at high count rate two gamma rays can cause both events to summed, which is known as pulse pileup
- This causes a broadening of the photopeak and a shift of the peak to the left
- This distortion is a result of deadtime
- Energy resolution
- Ideally the photopeak should have sharp lines and edges, which is not the case
- There are numerous problems that effect energy resolution
- Statistical variations in the number of scintillations light photons per keV of radiation energy deposited in the crystal
- Statistical variation in the number of light photons detected by the cathode (PMT)
- Nonuniform sensitivity to scintillation over the area of a PM tube
- Statistical variation on the amount of photoelectrons released by the cathode
- Statistical variation in the multiplication of the photoelectrons with each dynode
- Fluctuation in HV applied to the PMT
- Electrical noise within the PMT
- The major factor that distorts the pulse height is the variation on the number of photoelectrons released at the cathode
- Approximately 3 photoelectrons are produced per keV
- 137Cs would release, on the average, an initial 2000 photoelectrons (3 x 662)
- Variation of this value occurs when Poisson distribution is applied
- √2000 = +/- 45 photoelectron or 2.3%
- Hence to determine energy resolution one must look first at the photopeak. The point at which ½ maximum of the amplitude of the peak is considered energy resolution
- Known as full width at half maximum (FWHM) which is usually expressed in FWHM%
- This can be written as FMWM% = (∆E/Eγ) x 100
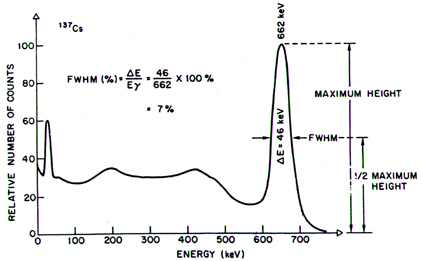
- By looking at the above photopeak it should be realized that the broader the peak is the greater % FWHM is and the poorer the energy resolution would be
- Typical %FWHM for Tc99m is 11 to 13% in smaller diameter crystals and 13 to 15% in larger diameter crystals
- Some computer software allows for the calculation of FWHM, which would be an excellent part of daily, weekly, or monthly, QC. Hence variations in %FWHM is an indication that there is a problem
- Cracked crystal or deterioration of the optical coupling grease increases the FWHM
- Energy linearity
- Most scintillation devices are linear between 0.1 to 2.0 MeV
- If the source to be detected is below 100 keV then recalibration with one or more low keV sources should be considered
Return to the beginning of the document
Return to the Table of Contents
1/15