- CSF is produced by the choroid plexuses and enters the ventricles
- Flows caudally to the third ventricle
- Passes to the posterior portion of the spinal cord and descends
- Crosses into the anterior portion of the spinal cord and then heads cephalically near the base of the spine
- (Point where the radiopharmaceutical injection will occur,
intrathecally, into the lumbar sub-arachnoid space) - (xx) indicate normal flow time of the radiotracer
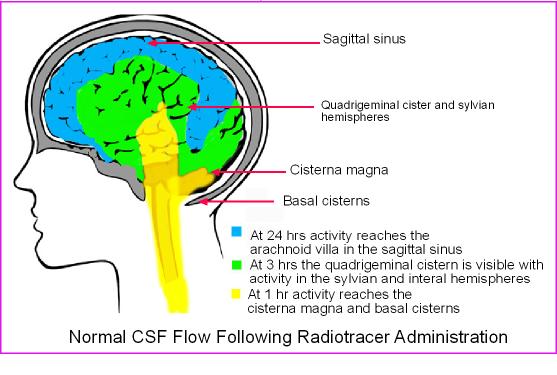
- Also refer to the image above
- Also refer to the image above
- (1 hour) CSF reaches the basal cisterns
- (2 - 6 hours) CSF arrives at the frontal poles and Sylvia fissure
- (12 hours) CSF is at the cerebral convexities
- (24 hours) CSF arrives at the arachnoid villi in the area of the sagittal sinus
- At this point the CSF is then absorbed back into the venous system
- Note - Normal CSF pressure will not cause CFS (or radiotracer) to flow back into the ventricles
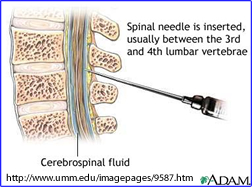
- 500 µCi of 111In-DTPA is injected intrathecally
- Injection is done using sterile technique
- Should be done by a trained physician, not the technologist
- In some situations the procedure needs to done under fluoroscopy
- Immediately following the injection, the injection site should be scanned to
assure that the radiotracer is in with the CSF compartment
- 100k image
- 128 or 256 matrix
- Collimator ME
- Dual energy peak setting
- 173 keV at 20%
- 247 keV at 20%
- 4 - 6 hour later imaging maybe done again and/or a 24 hour scan
- 24 hour delays images
- Use the same above protocol for all images: matrix, collimator, and energy peak
- Acquire ANT and a LAT
- 57Co source maybe used to mark the scalp or a 200 µCi technetium source maybe used to outline the skull
- 48 and 72 hour imaging maybe required when normal pressure hydrocephalus
is present
- Repeat the above imaging protocol as stated in the 24 hour delays
- Note increased scanning time will be required
- Normal images should indicate the activity exiting the arachnoid villa within 24 hours
- Hydrocephalus1
- Increased pressure of CSF can be caused by: over production by the choroid plexus, obstruction of flow to the arachnoid villa, or reduced absorption at the site of the arachnoid villa.
- Enlargement of the is usually noted and observed with CT
- Associated with communicating hydrocephalus
- Non-communicating
- Communication is the delay of the radiotracer >24 hrs to the arachnoid villa. It may or may not show activity in the ventricles. May also be referred to as normal pressure hydrocephalus
- Non communicating shows no ventricle activity
- Note: Considering the flow of the radiotracer - activity should not be seen in the ventricles
- Hydrocephalus defined Sodee (1994)
- Normal
- Type I: delayed reduced clearance/no ventricle uptake
- Type II: reduced clearance/ventricle uptake
- Type III: significant reduced clearance/no ventricle uptake
- Type IV: significant reduced clearance/ventricle uptake
- Type V: Foramen Magnum Block
- Hydrocephalus update - NHP patterns are noted in Types IIIB and IV2
- Type I - can be either normal or non-communicating hydrocephalus - key activity is seen over the convexities at 24 hours
- Type II - there is a delay in activity flowing over the convexities and no ventricle filling
- Type IIIA - delay in activity over the convexities with reflux into the ventricle
- Type IIIB - no activity seen over the convexities at 24 hours with intermittent ventricle filling
- Type IV - If activity within the ventricles is consistent
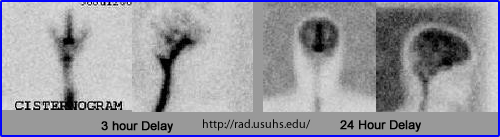
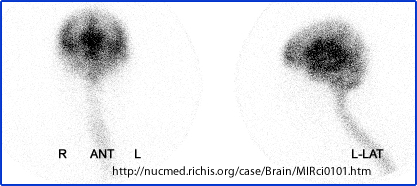
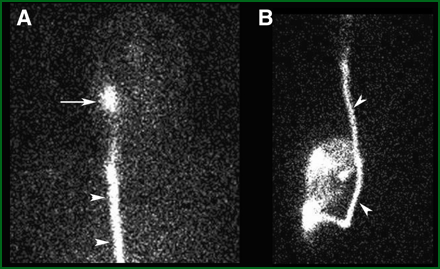
- This case is an example of what normal CSF flow should look like. You should also appreciate lack of activity in the ventricles at 24 hours and at the same time the activity has surrounded the exterior portion of the head (exiting out)
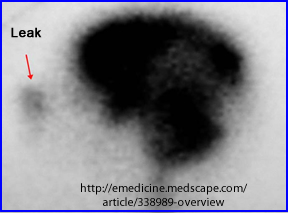
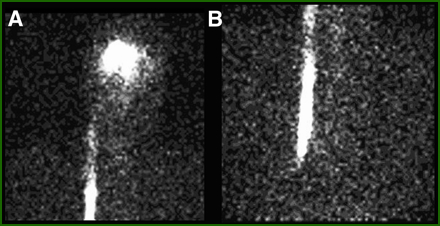
- Here is an example of a 48 hour delay cisternogram. Questionable activity has reached the superior sagittal sinus and there is definite accumulation within the ventricles
- SEE normal - https://fluidsbarrierscns.biomedcentral.com/articles/10.1186/1743-8454-6-5/figures/1
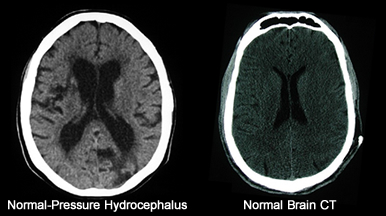
- From the above abnormal scan I thought it would be appropriate to look at what this patient's CT looks like. In addition, a normal brain CT is placed next to it. Note the differences in ventricle size. If you wish to know more abut the specific CT, click that section of the image