Perfusion Lung - Second Part of the V/Q
- What is Pulmonary Embolus? (while you should know the answer to this, let us go over the details)
- PE usually comes from Deep Vein Thrombosis (DVT)
- The facts about DVT's
- Diagnosis is difficult and non-specific, but maybe associated with leg swelling, pain, and discomfort
- DVT may result from: surgery, sedentary life style, CHF, Baker's cyst, and/or cellulitis
- Example of what a DVT make look like on a patient. It can be red and swollen. The term phlebitis, inflammation of vein is usually associated with DVT
- Estimated annual occurrence in the US population is 500,000 cases per year with a 20% death rate
- 50% of those patients who survive DVT's develop long term difficulties (post-phlebitic syndrome)
- One five-year study indicated that 10% of all patients that died in-hospital had PE when autopsied. In addition: 83% of those patients had DVT's; only 19% were symptomatic.
- Anticoagulant therapy is used to treat DVT and PE
- Heparin is the primary pharmaceutical used
- There is approximately a 5% chance of serious bleeding complications associated with this pharmaceutical
- Therefore, heparin should only be given when there is a high probability of DVT and/or PE
- DVT can be diagnosed invasively by contrast venography
- DVT can be diagnosed non invasively by Impedance Plethysmograph or AcuTect
- AcuTect (Apcitide) binds to active blood clots and increased uptake in the legs will indicate the presence of DVT. Current literature seems to indicate that this test has been taken off the market by the FDA
- Pulmonary Hypertension
- Pressure from the right ventricle
- Related to different diseases within the lung there can be an increase in
- Chronic Thromboembolic Pulmonary Hypertension
- An example of the chronic condition might be reminisce of scarred lung tissue caused by PE
- This causes the heart to increase blood pressure in the RV to compensate blood flow
- For more information on this condition visit this website - https://www.thoracic.org/patients/patient-resources/resources/cteph.pdf
- In both situations of hypertension reduced particles should be administered
- Split Lung scan
- Assessment of radiopharmaceutical distribution to assess tolerance from partial thoracotomy
- Usually occurs when a patient has lung cancer
- If a portion of the diseased lung can be removed is there enough lung tissue remaining for the patient to be able survive
- Link
- Radiopharmaceutical used is 99mTcMAA
- Size requirements (may vary slightly depending the manufacturer)
- 10 - 90 microns (90%)
- < 150 microns (10%)
- Capillary size = 7-8 microns
- Blocks the lower arteriole level of lungs
- Less than 1-to-1,000 arterioles are blocked, but may range as little as 1-to-10,000
- A safe range for the amount of particles injection is between 200k to 700k, but less for children.
- What would happen if too many arterioles were blocked?
- Note how time increases the amount of particles injected into the patient
- Let us first make the assumption that you have a reaction vial that contains 6,000k particles
- Secondly, the vial contains 40mCi/5mL of activity at 7am
- First prepare a 4 mCi dose at 7am and determine the amount of particles injected into the patient
- Second, prepare a second dose at 2pm and determine the amount of particles injected
- Calculations are as follows
- What might the consequences be if a patient is given too many particles?
- Death has been reported in patients who have pulmonary hypertension and cardiovascular disease
- Hence, identification of underlining complications is essential prior to injecting the MAA
- Technical considerations when administering 99mTcMAA
- When administering an IV injection - DO NOT flush the syringe with the patient's blood
- May cause small hot spots in the lung from the clumping of particles
- When administering an IV injection - the patient should be in the supine position
- If the patient is sitting upright when being administered, the radiopharmaceutical (MAA) will have significant count concentrated at the base of the lungs
- Particles break down in the lungs via enzymatic reaction
- The time it takes for the particles to be broken down depends on particle hardness
- Hardness varies from manufacture to manufacture
- Breakdown of particles is also defined as the biological T1/2 of MAA
- Once the particles do break down, where do they go?
- Tc-99m HAM (human albumin microspheres)
- HAM is a derived from human protein whereas MAA comes from animal protein
- Particle size is more uniform; 10 - 45 microns
- Created in a ultrasonic bath
- HAM is considered a better product when uniformity of particle is considered
- Seems to cause more adverse reactions - reason unknown
- Currently not available in the US market
- An interesting article using HAM in NM and Ultrasound
- The diagnostic ability for a V/Q scan is based upon mismatches presented in both studies
- Prospective investigation of pulmonary embolism diagnosis study (PIOPED)
- High Probability (>/= 80%)
- Two large mismatched segmental perfusion defects or
- Similar combination
- Intermediate Probability (20-79%)
- One moderate to two large mismatched segmental perfusion defects or
- Similar combination
-
Single matched defect with negative chest x-ray
- Low Probability (</= 19%)
- Non segmental perfusion defects
- Any perfusion defect with large chest x-ray abnormality
- Matched defect (perfusion/ventilation) - with clear chest x-ray and some areas of normal perfusion in the lung scan
- Any number of small perfusion defects with normal chest x-ray
- Normal
- No perfusion defects
- Chest x-ray and V/Q lung scan are normal
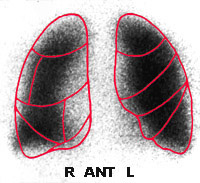
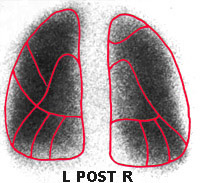
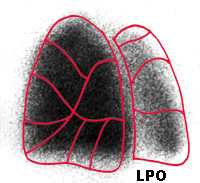
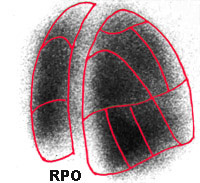
- A look at the segments in the lung (see diagram)
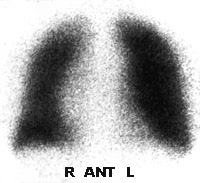
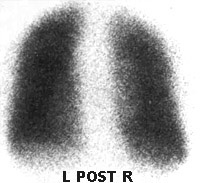
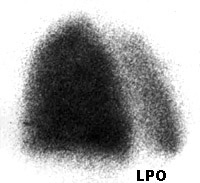
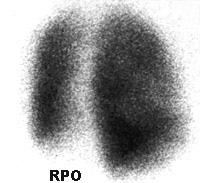
- The four most important images of a lung scan are the: POST, LPO, RPO, and ANT
- The above image shows the different segments outlined in a normal lung perfusion scan
- PE usually blocks a segment or sub-segment of the lungs
- While PE may only be found in one segment, it's usually multiple in nature, and found in more than one area
- Comments regarding the Lung Perfusion Procedure
- Administer 4 - 5 mCi of 99mTcMAA IV, while the patient is in the supine position
- Tell the patient to take several deep breaths after the injection is given
- Set Matrix size at 256 by 256
- Acquire 500k images for 5 minutes
- Take ANT, POST, LPO, RPO images. You may also take LAO, RAO, L-LAT, and R-LAT
- All perfusion images must match the same angles taken of the ventilation image, if 99mTcDTPA is used
- A chest x-ray must also accompany the procedure and should be taken within 24 hours pre-V/Q exam. Otherwise, a new chest x-ray must be taken and submitted with the V/Q procedure
- Additional comments to consider in a V/Q scan
- The "fissure sign" is occasionally seen in a perfusion scan. This is due to fluid build-up (pleural effusion) seen between the segments of the lung and is non-specific for PE. The image will show photon-deficient areas between lobes/segments. (link to article)
- Pulmonary emboli are multiple in 90% of cases, bilateral in 85%, and may often appear more toward the base of the lung where blood flow is greater.
- Additional indications of the perfusion defect that may indicate PE is/are:
- The larger the perfusion defect, the greater the probability of having PE
- Can be wedge-shaped
- Perfusion images look worse than the ventilation images
- Occasionally PE will cause an entire lung (R or L) to be absent, but more often this is due to a large mass suppressing the R or L pulmonary artery.
- Eighty percent of all ventilation images are normal when PE is present. However, a recent onset of PE (within 6 hours) may also cause a bronchoconstriction to the same area, demonstrating a matched defect. This is rarely seen.
- Chest x-ray may show other underlying disease that will correlate to matched defects on the V/Q study.
- Comments on pulmonary angiograms
- This is still considered the gold standard for diagnosing PE
- Usually this is done when the V/Q scan is indeterminate
- There is significantly greater risk to the patient if an angiogram is performed
- Recently, spiral CT has been used to diagnose PE, and the literature is currently inconclusive as to whether this could replace the V/Q scan. However, the difficulty of using CT relates to patient cooperation; the patient must hold his/her breath while being scanned. This may be especially difficult for the patient who is SOA.
- The pretest likelihood of a patient having suspected PE includes the following criteria: ordering a V/Q scan for suspected PE is rather nebulous, however, "classic" triad is dyspnea, pleurisy, and hemoptysis
- Other symptoms for PE include: reduced PO2 levels that do not improve when the patient is given O2; DVT symptoms; dyspnea; coughing; pleuritic chest pain; tachycardia; and/or post partum.
Case studies
Case I
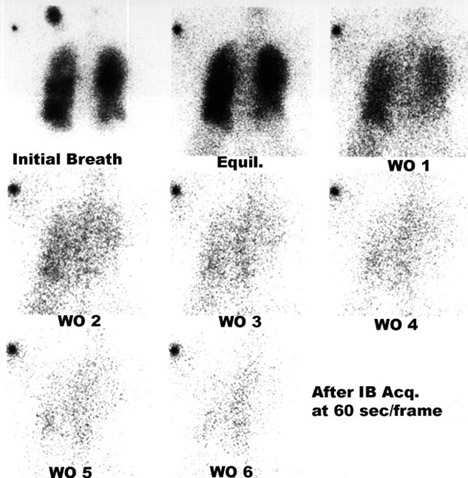
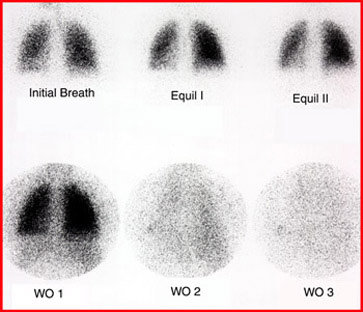
The first set of images is an example of a Xe133 ventilation scan with some trapping noted. Note all three parts of the ventilation procedure: Initial breath, equilibration, and wash-out.
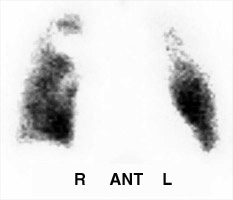
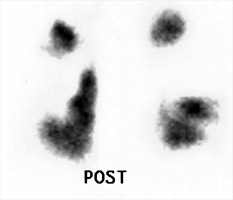
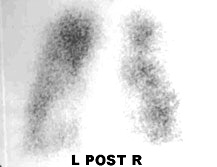
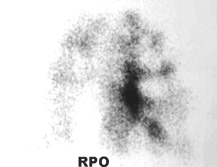
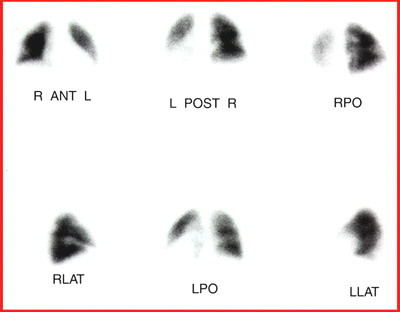
Following the ventilation scan, a perfusion lung scan was performed on the same patient. The four basic views are displayed: ANT, POST, LPO, and RPO.
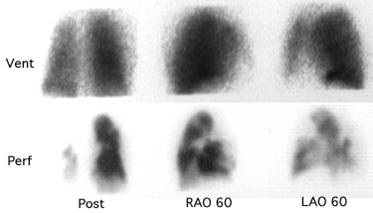
Case II
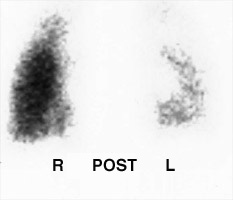
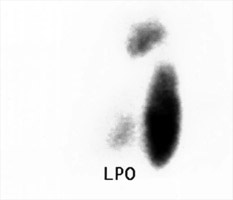
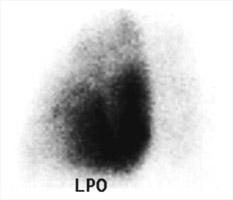
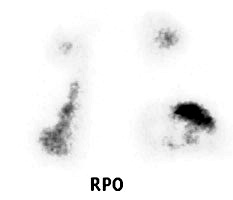
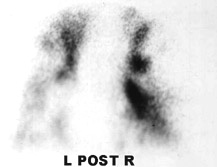
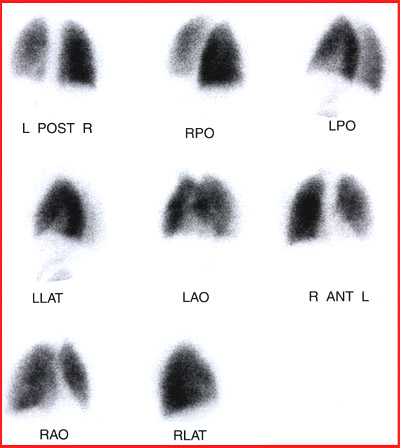
The next case study is an example of a patient who was diagnosed with a high probability of PE. The V/Q scan consists of 99mTcDTPA for the ventilation scan and 99mTcMAA for the perfusion scan. Compare the amount of segmental abnormality with criteria supplied on the PIOPED study.
Perfusion Imaging
 |
Ventilation Imaging
 |
 |
 |
 |
 |
 |
 |
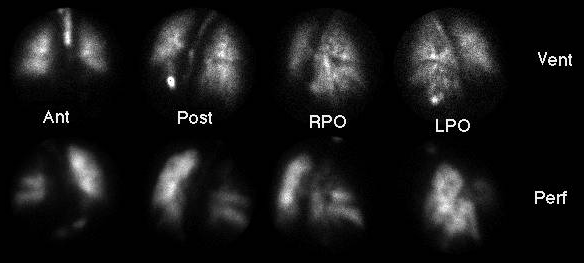
Case III
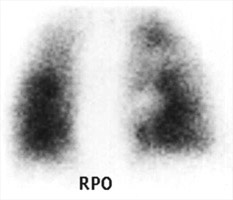
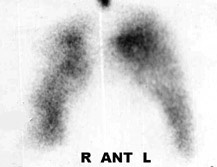
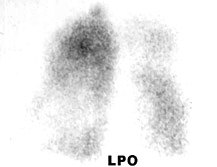
The next case is an example of COPD with a low probability for PE. Ventilation was completed with 99mTcDPTA and the perfusion scan was imaged with 99mTcMAA. You should note the PIOPED criteria, and also be able to appreciate the increased difficulty COPD plays on diagnosing disease.
Perfusion Images
 |
Ventilation Images
 |
 |
 |
 |
|
 |
 |
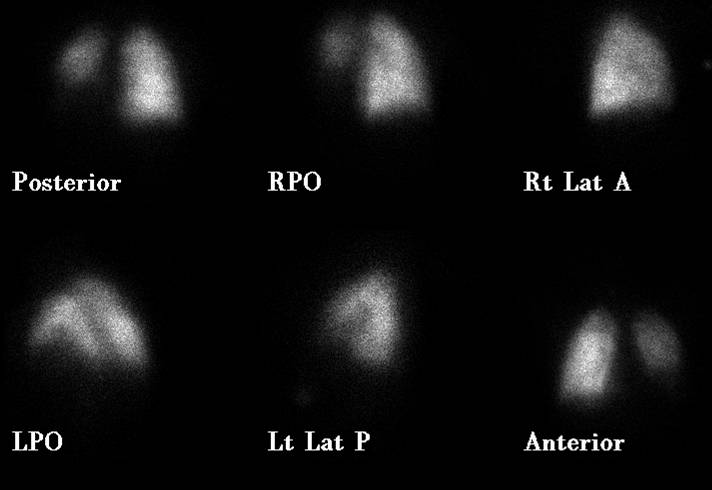
Case IV
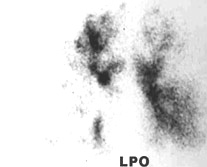
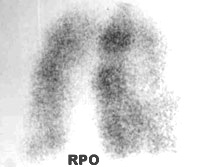
The last case is a patient diagnosed with PE. The patient was put on heparin therapy for 5 days and the perfusion scan was repeated. This is a good example of how anticoagulant therapy can resolve the perfusion defects over time. However, it should be noted that sometimes the lung perfusion image(s) that contain defects do not always return to normal. This can occur with older patients that initially have a large perfusion defect caused by PE.
Pre-therapy Images
|
 Pre-therapy Images
|
Repeat perfusion images post 5 days of heparin therapy
|
Special comment: There has been a lot of information presented in today's lecture that relates to diagnosing PE. Likewise, the technologist should learn to appreciate how V/Q imaging is perhaps the most important diagnostic tool used to identify PE. In addition, understanding its diagnostic potential should assist the technologist with the technical understand of these procedures. However, the technologist should NEVER use this knowledge to actually diagnose disease -- that is the role of the physician.
Now let us see if you can figure what is going on in the following images. Please answer the comments/questions.
-
The above images are acquired in ventilation and perfusion. Are they abnormal? What is the disease?
- Here is an angiogram of the chest. Can you find the PE? Roll you mouse over the image and the red arrow will show you where it is.
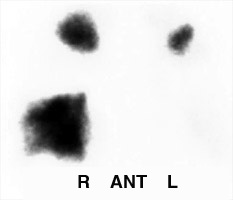
- There are two comments to note on this V/Q Lung Scan. First, note the activity in the stomach and main stem bronchi. Why is this seen on the ventilation images? Secondly what is the mismatch defect is an indication of?
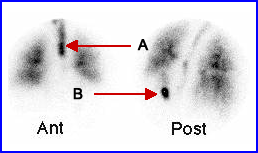
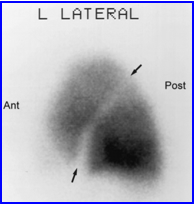
- In ventilation images abnormal uptake can be seen in the areas labeled A and B. Why do they occur and what part of the human anatomy do they represent? This uptake seen outside the lung is somewhat typical of this procedure.
Ventilation Scan with 133Xe
Perfusion Scan
In the Ventilation portion of this procedure, what causes the excessive uptake in the washout phase?
In the perfusion phase of the procedure, what causes the LLL of the lung to lack activity? 
- As a general rule, in a normal study the perfusion portion of the scan is of better quality when compared to the ventilation quality. Furthermore, there are no mismatched defects with only mild evidence of COPD.
- This is yet another example of a V/Q lung scan. Why is lung uptake so poor? What causes the liver, kidney, brain, and thyroid uptake? Notice the hot spot in the lung, what is it? Click the image for more information.

Click here for enlarged image
- Application of lobe or regional analysis in comparing ventilation. Notice matched, mismatched, and normal areas of the lung. This helps further identify disease
- Suggested reading - application of 68Ga-MAA and Galligas in the treatment of lung cancer
Here are some additional sites related to V/Q imaging which you may want to explore on the Web
The actual PIOPED chart it displayed and an article on PIOPED related to its use in lung imaging.
This article discusses and is entitled, "The Controversies in Pulmonary Embolism and Deep Venous Thrombosis." By Bruce L. Davidson, M.D., M.P.H. http://www.aafp.org/afp/991101ap/1969.html
If you would like more information on PE and case studies that show this disease visit the following website: http://www.auntminnie.com/ScottWilliamsMD2/Chest/Vascular/PE/PE.htm
PET/CT Lung Ventilation and Perfusion Scanning using Galligas and Gallium-68-MAA - https://www.sciencedirect.com/science/article/pii/S0001299818300795?via%3Dihub
Return to the beginning of the document
Return to the Table of Content
10/22