Liver/Spleen Imaging
- Liver agents (however, there are many other uses that will be discussed next year)
- 99mTcSC (sulfur colloid)
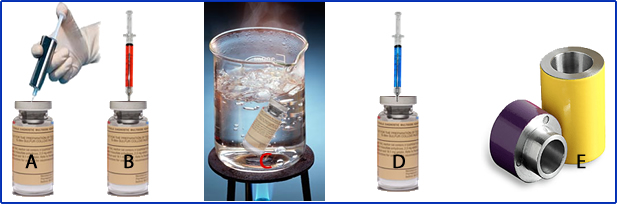
- A - Na 99mTc04- is added to the reaction vial that contains an acidified sodium thiosulfate, disodium edetate (Al+3 chelator), and gelatin
- B - Syringe of HCl is added to the vial
- C - The vial placed in boiling water ( 100oC) for 5 minutes [make sure your vial is shielded]
- D - Anhydrous biphosphate and sodium hydroxide
- E - Vial of sulfur colloid should be placed into a lead pig
- What makes the particles?
- When the vial is boiling acidified solution reacts with thiosulfate, causing it to hydrolyze generating sulfur
- Sulfur atoms collect and grow in size
- Gelatin adds a protective coating to the particle surface that also has charge which makes the colloid particles repel from one another
- The final yield is technetium heptasulfide
- The formula is identify below
- A buffering solution is then added to stabilize the particles
- Comments on particle size
- Increasing the time in the heated water bath increases particle size
- Gelatin also affects particle size - the more the gelatin the larger the size
- Particle size ranges from 0.01 to 1.0 microns
- 99mTcAC (Microlite or albumin colloid) - this drug was taken off the market, however, the link is an article published about Microlite
- Preparation only requires that technetium be added to the reaction vial
- To the best of my knowledge, the product is not currently available (per Cardinal Health)
- Colloid physiology
- Particles are phagocytized by reticular endothelial cells/system (REC/S) located in the liver, spleen, and bone marrow
- Sulfur colloid T1/2 in the blood stream is approximately 2 - 3 minutes and is rapidly cleared from the blood stream (under normal conditions)
- It is believed that the largest particles go to the spleen, smaller particles go to the liver, and the smallest particles go to the bone marrow
- Under normal conditions, 80 to 90 percent of the particles are sequestered by the liver, 5 to 10 percent in the spleen, and 5 percent to the bone marrow
- REC's located in the liver are defined as Kupffer cells
- Blood flow
- 75% to 80% of blood flows to the liver is venous and comes from the portal vein
- 20% comes from the hepatic artery
- Vascular tumors, such as hepatomas and metastatic disease, show increased uptake in the arterial phase as seen on a dynamic acquisition
- Why would tumors more likely be seen in the arterial phase?
- General comment about diseases - They are classified in two types
- Space Occupying Lesion (SOL) - note particle distribution
- Tumor single (cancer and non-cancer)
- Metastatic
- Trauma
- Usually seen as cold area, but in rare occasion can be hot
- Hepatocellular disease (HD) - note particle distribution
- Disease at the cellular level usually damages the entire liver
- Cell damage and colloid shift
- Initial damage causes hepatomegaly
- As damage increases, colloid shift occurs, where excess colloid particles shift from the liver to the spleen and bone marrow
- Decreased blood flow from the hepatic artery
- Increased blood flow to the portal vein, known as portal hypertension
- As disease continues to progress decreases liver perfusion occurs and splenomegaly results
- As disease continues to progress with an increase to bone marrow activity
- Liver failure results with little to no perfusion in the liver, splenomegaly with increased uptake, and excess bone marrow uptake
- A closer look at disease in the liver
- Liver filters out bacteria, viruses, particles, and poison in the blood stream
- At the cellular level, damage will occur to the liver increasing its size
- As damage continues, fatty deposits infiltrate the liver sinusoids
- Liver can regenerate if no additional damage occurs
- Under continual assault to the liver the following occurs
- Small infarcts in the arterioles
- Necrosis
- Colloid shift
- Spleen and bone marrow uptake increase
- Particle perfusion in the liver continues to reduce
- This usually results in hepatitis and cirrhosis
- Comments on hepatitis
- Hepatitis A occurs quickly and leaves little liver damage
- Hepatitis B lasts longer and may result in some liver damage
- Hepatitis C is considered a chronic disease, which in 50% of cases will lead to cirrhosis
- Evaluation of liver/spleen imaging
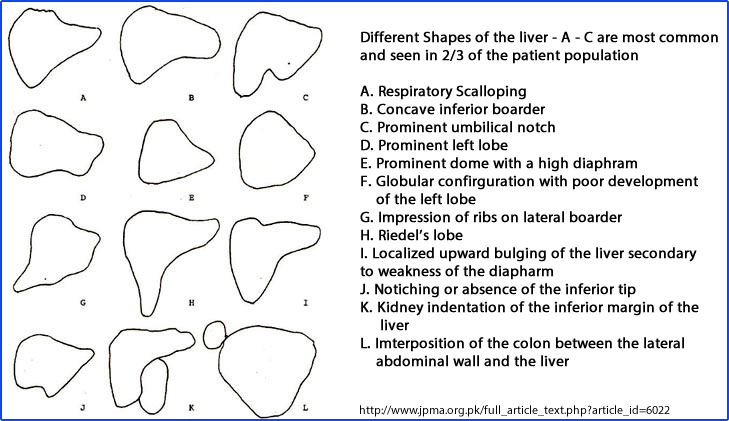
- According to the literature there are some 16 different shapes of the liver, all of which are considered normal. Above are examples of 12 different shapes
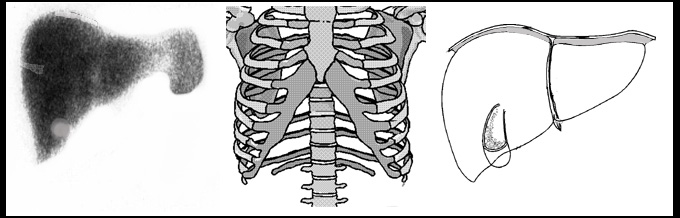
- Many different artifacts can attenuate liver activity and appear as a questionable abnormality, seen on a planar image. Consider the following
- Anterior may show: gallbladder fossa, falciform ligament, diaphragm, ribs, and/or breast.
- Posterior view may show: Kidneys, spine, and/or ribs
- From the image below, identify artifacts seen in the anterior view of the liver
- How do you determine if there is a lesion or an artifact on a planar image?
- A lesion within the liver is intrinsic and will remain in the same position when a different angle/image is taken
- A artifact outside the liver will be extrinsic to the liver and will move to a different location when a different angle/image is take
- Therefore, in planar imaging numerous images are required at different angles to differentiate between artifacts and lesions
- SPECT imaging does not have this problem. Why?
- Homogeneity of the tracer
- A normal liver scan will show even distribution of colloid particles throughout the liver
- However, the left lobe does tend to have less activity, when compared to the right lobe
- Which acquisitions are best for assessing the liver and spleen?
- Anterior best visualizes the liver since it is more anterior. What about RAO and R-Lat?
- Posterior best visualizes the spleen since it is more posterior. What about LPO and L-Lat?
- Presence of liver/spleen defects - Link to lecture on liver diseases
- For the most part cold spots are usually seen in liver/spleen imaging, defining SOL - The question is, what type of disease? Why do many SOL diseases look similar?
- There are several exceptions to this rule of photopenia. Some diseases will have an increase in activity. These associated liver disease are:
- Tumor in the superior vena cava causes increased uptake in the anterior central portion of the liver. This is due to recanalization of the umbilical vein, causing excess venous drainage to the affected area in the liver
- Hot spots outside and above the liver maybe be due to: a mixture of clotted blood from the sulfur colloid administration which lodges in the lung or remnant spleen tissue
- Focal nodular hyperplasia - extra "liver tissue may appear hotter than surrounding tissue
- Enlarged liver and/or spleen indicate disease
Return to the beginning of the document
Return to the Table of Content
Liver/Spleen Scan
10/21
Sulfur Colloid Package Insert
Liver/spleen procedure