- SPECT is, in many ways, very much like a CT scan in radiology
- The differences are:
- The radiation source is emission vs. CT is transmission
- Nuclear medicine looks at physiology, not anatomy
- SPECT resolution has a matrix size of 64 or 128, whereas CT is 512 or 1024
- Acquisition time in CT is VERY fast, but SPECT is VERY slow
- In helical CT, the x-ray tube spins around the patient as the table moves. This allows us to image a significant part of the human anatomy.
- SPECT's FOV is limited to the size of the detector
- The computer algorithm or image reconstruction that produces tomographic slices is similar in both systems

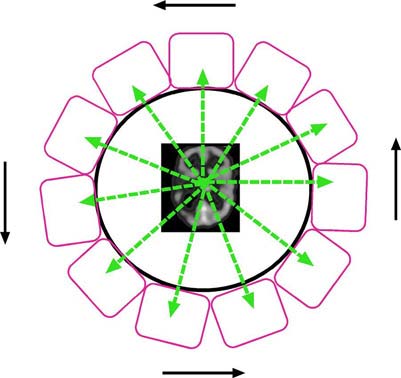
- The above image shows how a detector or a set of detectors collects information within a 360 radius around the organ of interest
- The acquired data is then reconstructed via a filtered backprojection protocol, where the images are projected back at each angle acquired
- Most SPECT systems have two detectors, however, three detectors systems are available
- The following acquisition parameters are used and will vary pending the type of procedure being acquired:
- One-hundred-eighty degree rotation, cardiac only
- Usually, cardiac is imaged at a 64 matrix with 32 stops
- Most 360-degree acquisitions are set at a matrix 64 with 64 stops
- In certain procedures, a 128 matrix may be applied, and usually 128 stops are acquired
- As a general rule, acquisition time should be no more than 30-minutes
- Once the data is collected, the raw data can be displayed in a cine format, as seen above
- The above acquisition is of a pediatric brain scan
- Raw data is the reconstructed/processed that will produce the tomographic slices
- Filtered backprojection is applied, and imaging filters are used to enhance image quality
- The goal of filtering is to remove background counts and reduce noise
- Can you recall the definition of image noise?
- The goal is to only keep the true counts
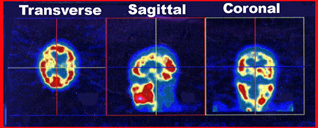
- Transverse, sagittal, and coronal images are generated and "centered," as seen in the displayed above
- Again, it is essential to realize that the concept presented today is fundamental
- From the above rotating SPECT images, the three types of slices are displayed (see above image)
- It should be noted that these slices are only 2 pixels thick and have approximately 15 slices per each angle that are not being displayed (transverse, sagittal, and coronal)
- Here is another example of ALL the slices you would see in a normal brain scan
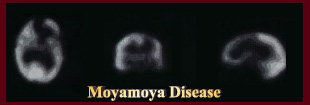
- From the acquired data, the lack of uptake in the frontal lobe of the brain is demonstrated
- Moya Moya disease may starts with pediatric patients where calcification within the arterial structure of the brain occurs. The result is a loss of blood flow to specific areas of the brain
- Moya Moya disease - in Japanese, it means "puff of smoke." Refer to the link


- Collimation - HR or UHR
- Energy Setting - 140 keV with 20% window
- Rotation - 360 elliptical or body contour
- Matrix 64 with 64 slices
- Matrix 126 with 128 slices
- Two heads are better than one
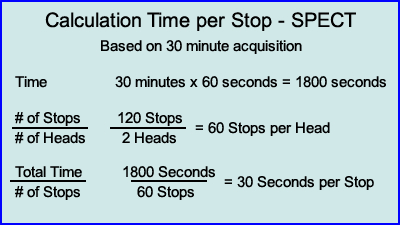
- Time per slice calculation - In general, you should never image longer than 30 minutes and a 2-headed SPECT system is preferred
- Calculate the time per stop on a 30-minute acquisition - see above
- Other points of interest
- Why does SPECT have fewer counts than a spot view?
- Even though a SPECT scan may have more total counts, the resolution is based on the number of counts acquired in a single stop
- Is image shows the position of transverse, sagittal, and coronal angles
- Here is an example of where a spot view on a bone scan seems normal, however, when SPECT images are taken abnormal uptake is seen

Return to the beginning of the document
Return to the Table of Contents