Purpose of this exam is to examine and evaluate hepatobiliary flow in the liver
Hepatocytes pick up the radiopharmaceutical
Bile flows through the hepatic ducts
To the cystic duct and gall bladder
Bile flows out of the gall bladder into the common bile duct, then into the duodenum
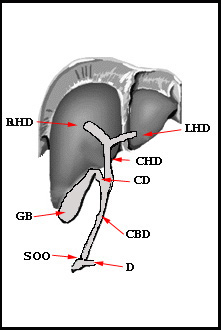
Right Hepatic Duct (RHD)
Left Hepatic Duct (LHD)
Common Hepatic Duct (CHD)
Cystic Duct (CD)
Gallbladder (GB)
Common Bile Duct (CBD)
Sphincter of Oddi (SOO)
Duodenum (D)
Falciform Ligament (FL)
Diagram of the hepatobiliary tree
Normal hepatic flow
Hepatobiliary Agents - these types of radiopharmaceuticals will be identified as 99mTcIDA or IDA. By forming different N substitutions on the carbon ring, different forms of IDA (Iminodiacetic acid) have been produced:
99mTc HIDA (dimethyl)
The original agent
In a normal functioning liver 85% of this agent is excreted via liver and 15% is excreted by the kidneys
Increased levels of bilirubin reduce hepatic uptake with increased kidney uptake
Acceptable bilirubin level for hepatobiliary imaging is up to 5 - 7 mg/dL
99mTc DISIDA (Disofenin) (Hepatolite)
Normal functioning liver: 88% of this agent is excreted by the hepatic system with 10% by the kidneys
Acceptable visualization of the hepatobiliary tree can occur with up to 20 mg/dL of bilirubin
99mTc BROMIDA (Mebrofenin) (Choletec)
Has the greatest hepatic uptake at up to 98%
Least affected by high levels of bilirubin
General comments on IDA physiology
Once injected, IDA binds to plasma protein, which reduces renal excretion
IDA competes with bilirubin at the same sites of extraction on the hepatocytes, via a process known as competitive inhibition
The greater the level the level bilirubin, the less the uptake of IDA and the greater the renal excretion
IDA and bilirubin are extracted by the hepatocyte via active transport
Improved IDA extraction occurs when the compound is more lipophilic, creating a stronger protein bond. Reduces renal extraction
Increasing the length of the alkyl chain substituted on the benzene (carbon) ring also improves biliary excretion and reduces renal excretions
Therefore, DISIDA and BROMIDA are the preferred radiopharmaceuticals when patient have high levels of bilirubin
How is bilirubin/bile produced?
(Refer to diagram)
Heme is the source of bile pigment
Heme is the end product in hemoglobin breakdown that results in 80 to 90% of the bilirubin produced in adults
As stated above, bilirubin and IDA competes for the same sites on the hepatocytes
Hepatocytes are also referred to as parenchymal cells
More on bile production
Hepatocytes produce between 500 and 1000 ml of bile per day.
From the hepatocytes bile is secreted into tiny bile calculi that run between hepatocytes and drains into branches of the bile ducts located in the portal triad
Eventually this merges with the right and left hepatic ducts, which both connect to the common hepatic duct
The common bile duct is starts where the common hepatic duct meets the cystic duct meet
The cystic duct connects to the gal bladder that is about 10 cm in size and stores around 50 mL of bile. When fatty chyme reaches the enteroendocrine cells within the duodenum this stimulates the vagus nerve that causes CCK production. CCK then stimulates the gal bladder contraction and relaxation of the sphincter of Oddi. Bile then flow down the common bile duct into the duodenum
A look at GB diseases
Gee, let's first make a comment or two regarding a normal scan
Normal bile flow throughout the hepatic system
Gall bladder images within the hour
EF of the GB is >38%
Acute cholecystitis
Gall stone blocking the cystic duct
Gall bladder does not image
Chronic cholecystitis
Temporary blockage of the cystic duct
Gall bladder appears post 1-hour injection
Acalculous cholecystitis (vs. calculous)
Blockage without stones
Slug/inflammation of the gall bladder
If or when the gallbladder fills, there is a reduced injection fraction when sincalide is administered (synthetic form of CCK)
Other Blockages within the hepatic tree
Calculous or tumor
Activity maybe blocked at the R or LHD, CHD, CBD, or small intestine
Bile leak
Usually follows postoperative removal of the gall bladder
Activity empties into the surrounding gallbladder fossa and/or the hepatic tree
Bile reflux
Bile refluxes upward from the duodenum
Activity is noted at or above the left lobe of the liver
Gallbladder perforation
High mortality occurs when surgical intervention is not completed
Does not have to occur with cystic duct obstruction
More common in elderly patients and/or chronic cholecystitis
Biliary atresia vs. neonatal hepatitis
Performed on new born infants
The question, "Is the hepatobiliary tree connected to the small intestine in the jaundice infant?"
(From a historical perspective) I-131 Rose Bengal was used prior to the development of IDA
Dose was administered
Followed by a 72 hour fecal collection
Fecal material was mixed into a single container to determine the amount of mL
A sample of the fecal material was counted, multiplied by the total mL, and the excreted dose was compared to the dose administered
If less than 5% percent of the dose was excreted, biliary atresia was diagnosed
(Today's current approach) Prior to the IDA scan, the infant is dosed with 2.5 mg/kg orally BID for 5 to 7 days with phenobarbital
Phenobarbital improves excretion of IDA through the hepatobiliary tree
If activity is not seen in the small bowel, then biliary atresia is diagnosed
Activity is seen in and around the gallbladder fossa as a "rim" of activity
Results from tracer retention and bile status in an inflamed, edematous gallbladder where activity does not enter the GB
False positive results can be caused by
If the patient has not been fasting for less than two hours GB which may cause delayed or no visualization of the GB
Patients on total parenteral nutrition (TPN)
Prolong fasting (24 hours or more)
Chronic cholecystitis is the cause
"Sludge" accumulation in the GB remedied by the administration of CCK 20 to 30 minutes prior to IDA injection
CBD obstruction
Hepatocellular dysfunction (due to poor tracer uptake and slow blood clearance of IDA
Morphine sulfate augmentation
Administered when there is dumping of the tracer into the small bowel, but no activity is seen in the GB
Without morphine delay, images should be done for at least 4 hours
If activity is not seen in the GB after 1 hour, administer 0.04 mg/kg morphine IV for 2 to 3 minutes
Assume you have a 214 lb patient, what amount of MS would you administer? Ans
Causes constriction of the Sphincter of Oddi with pressure building up in the CBD
Continue imaging every 5 minutes for up to 30 minutes
If GB does not visualize, then acute cholecystitis is diagnosed
CCK should not be administered with this procedure
If CCK is used pre- or post-morphine, a 30 minute delay for administering the second pharmaceutical must be followed (Issue? The T1/2 of MS is 2 hours)
Should be given to the patient if he/she has been NPO for greater than 24 to 48 hours
Reason - GB stasis
Kinevac dose = 0.02 μg/kg of body weight
Dose patient 30 minutes prior to IDA injection
Causes contractility of GB reducing a false positive study
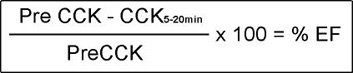
Determination of GB ejection fraction (see formula below)
Determine when the GB is at maximum filling
Inject Kinevac IV over a 3 minute period of time or (administer as IV drip 30 to 45 minutes - see discussion)
Kinevac dose = 0.02 μg/gm of body weight
Post 5 minutes take an image for every 5 minutes for a total of 20 minutes
Draw an ROI over the PreCCK of the GB - Should you preset the time after this or just go for a specific amount of counts?
Draw an ROI over every other GB image that is acquired
Plug in the numbers to the above formula to determine %EF of the GB
If the EF of the GB is <30% chronic cholecystitis is diagnosed
If the EF is between 30 and 35%, it is indeterminate
If the EF is >35% the GB is considered normal
Note: It is very important to administer exactly over a 3-minute period using a pump. Manual administration may alter the %EF of the GB
Substituting Sincalide
When not available and lactose-free fatty meal is given PO
Dose - 240 mL containing 11.4 gm of fat - Ensure Plus
Krishnamurthy and colleagues dosed 13 health volunteers with CCK-8 IV (3 ng/kg/minute for 10 minutes). This was followed up with an half-and-half at a later time
Ensure Plus mean was 53.6% ± 20.2%
CCK-8 (sincalide) EF first dose mean was 75.8% ± 16.3%
CCK-8 EF second dose mean was 71.3% ± 17.4%
Data should be acquired for 60 minutes
Lower end of normal EF for sincalide substitute is 33%
Comments regarding the EF of the GB
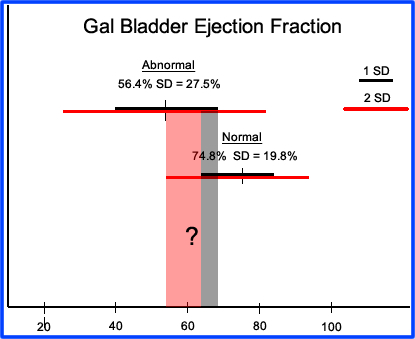
Pomeranz, et al studied 30 normal volunteers and 67 patients with chronic disease
20ng/kg of sincalide was administered over a 15-minute period
Mean %EF for the normal group was 74.8 (SD 19.8%)
Mean %EF for the abnormal group was 56.4 (SD 27.5%)
Two negative SD in the normal group falls at to 35.2%
Two positive SD in the abnormal group is greater than 100%
Do you have a problem with these numbers?
Where does the abnormal deviation lie when compared to normal?
Ziessman, et al compared the 3-minute administration of CCK with a 30-minute infusion using a 0.02 μg/kg dose on 23 healthy volunteers
Using a cutoff of >35% EF for normal
74% of the patients had a normal EF using the 3-minute administration
91% with the patients had a normal EF using the 30-minute infusion
In addition, patients receiving the 30-minute infusion had no CCK-side effects while the 3-minute injection of CCK did
Sarva, et al administered 20 ng/kg of octapeptide-CCK to 22 normal volunteers and varied the time of administration
Mean %EF at 45 minutes infusion rate was 77.2% (SD 4.9%)
Mean %EF with a rapid 1-minute injection was 52.2 (SD 9.3%)
Hence, variation of the administered dose over time does affect the %EF of the GB
Also, no side effects were noted with patients receiving the 45-minute infusion
Finally an article came out by Dr. Ziessman that assessed all the issues that revolved around EF of the GB. Above is a chart that shows you the variations of different investigators with different infusion rates and variation of EFs. The multi-trail assessment concluded:
0.02μCi/kg administered over 60 minutes
The value to calculate the EF of the GB should be done at the 60 minutes image
This method had the lowest coefficient of variation
The lowest range of number was 38%
Comments on Imaging
Questionable GB uptake around the gallbladder fossa
Perhaps the best view is the R-LAT to determine if possible uptake is the gallbladder or bowel loop mimicking the GB uptake on the ANT image
Non-vis of the GB with extensive activity in the small bowel
If the majority of counts in coming from the small intestine, minimal activity in the GB maybe missed
Shield the small bowel to increase the count density in the area of interest (GB)
This becomes crucial in delayed imaging
If the EF of the GB is < 35% administer a second dose of CCK
Sludge in the GB maybe forced out in the first dose of CCK
Second dose may than improve %EF
Possible CBD obstruction - How long do you image?
Imaging should be done up to 24 hours post dose of IDA
Delayed images may show some activity passing through the CDB indicating only particle CBD obstruction
Never inject CCK and morphine within 30 minutes of one another
Questions
What causes increased levels of bilirubin?
How would increase levels of bilirubin effect imaging quality using IDA?
What is the difference between neonatal hepatitis and biliary atresia?
When is CCK used in hepatobiliary imaging?
When is morphine used in hepatobiliary imaging?
Identify the flow of bile, from the hepatocytes to the small bowel.
Case Studies
Case 1
The first case you've seen before. It is an animated .gif showing bile moving through the hepatobiliary system. In these images you should be able to identify the GB and small intestine, all of which imaged within 60 minutes after the patient was injected (this is considered normal). However, there is an abnormal accumulation of activity seen just below the left lobe of the liver. This abnormal accumulation of activity is known as bile reflux.
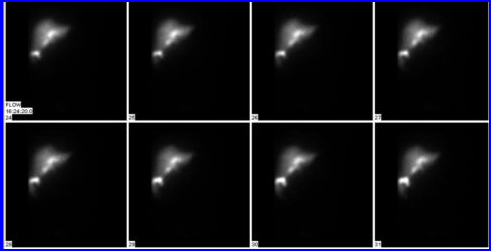
Case 2
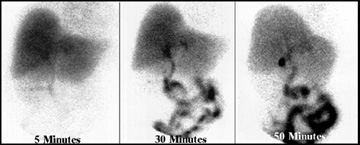
This case is an example of a normal hepatobiliary scan. The 5-minute image shows normal perfusion of the radiopharmaceutical in the hepatic cells. The 5-minute image shows activity in the myocardium, which is seen above the left lobe of the liver. The 15-minute image identifies activity flowing all the way to the small intestine. At 50-minutes the gall bladder contains radio-bile, indicating that the cystic duct is patent.
Case 3
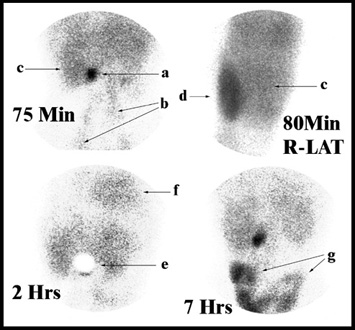
The third case is an example of a patient with a high bilirubin level and partial common bile duct obstruction. All images show poor perfusion of the radiopharmaceutical in the liver. The gallbladder images at 75 minutes, with no activity in the small intestine. In addition, the right lateral view at 80 minutes shows a very hot kidney, indicating that a lot of the radiopharmaceutical being excreted by the kidneys (indicating a high bilirubin level). From a technical standpoint, the gallbladder is shielded at the 2-hour image to increase the count density around the surrounding tissue. This results in picking up a small amount of activity being excreted into the small intestine. Finally, the 7-hour image, shows activity in the small bowel. Because of the length of time taken for radio-bile to reach the small intestine, partial small bowel obstruction is indicated. Partial obstruction may be do to tumor or a gall stone.
The following parts are labeled in the images below: a) gall bladder; b) activity in the femoral arteries; c) right lobe of liver; d) kidney; e) shield over gall bladder; f) activity in blood pool (myocardium); and g) small intestine.
Case 4
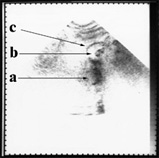
The following parts are labeled in the sonogram image taken in B Mode - left: a) shadowing caused by stones; b) gall stones; and c) gall bladder wall. On the right is an image which displays 3D image of a large gall stone.
Case 5
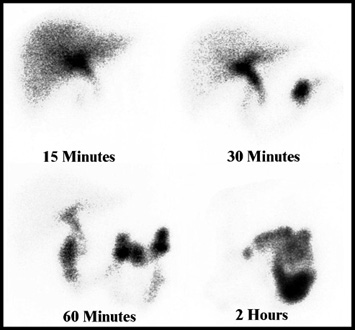
Regarding this hepatobiliary scan, the selected images show: normal liver perfusion of the radiopharmaceutical; activity dumping into the small bowel at 30 minutes post injection. At 2-hour there is no activity seen in the gall bladder. This is an example of acute cholecystitis.
Question: From a technical standpoint, how might you further confirm that there is no gall bladder activity in the 2-hour image?
Case 6
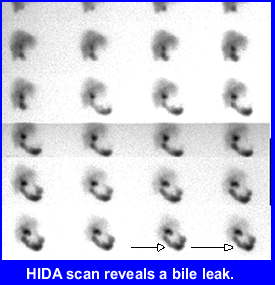
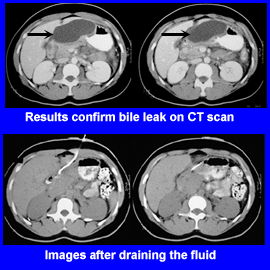
This is an example of a bile leak, which occurred after surgery, caused when this patient underwent laparoscopic cholecystectomy. Two weeks after surgery the patient was examined in the ER and complained of vomiting, low grade fever, and tenderness in the URQ of the abdomen
The hepatobiliary images indicate a bile leak. CT further confirms that presences of a leak. A French Elecath was implanted and drained the site for four days. A second set of CT images indicate that the leak has been repaired and the fluid has been drained.
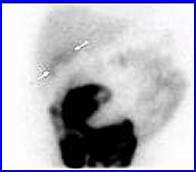
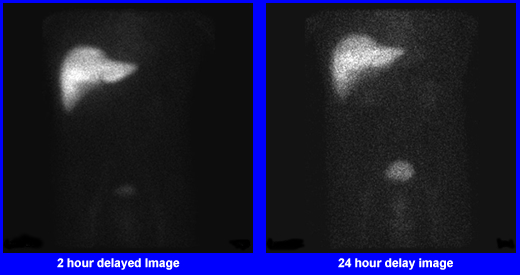
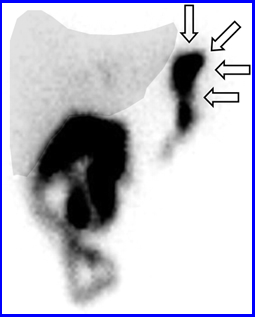
Following the delayed images of a hepatobiliary scan activity is noted distal to the left lobe of the liver (arrows). Why are the arrows pointing at and how can you explain this abnormal accumulation of activity? Answer
Patient underwent laparoscopic cholecystectomy five days prior to this study. She was admitted to the ER with belly pain and vomiting. The above hepatobiliary was taken over 60 minutes. What is your impression? Answer
Here is a case in which a patient was first given CCK half-an-hour prior to injecting the IDA agent. Sixty minutes later MS was administered. What is your diagnosis?
Patient is s/p open cholecystectomy, presented to the emergency room on post op day 10 with abdominal pain and vomiting. Answer
Case 12
After 1 hour of imaging the following image is taken. The arrows in the image is an indication of what? Roll your mouse over the image and you will see an ultrasound of the gal bladder. Answer
Following the administration of Bromida the above images where taken. 1) Would you inject CCK-8 to determine EF of the GB? 2) What appears to be going on with this patient? Answer
Case 14
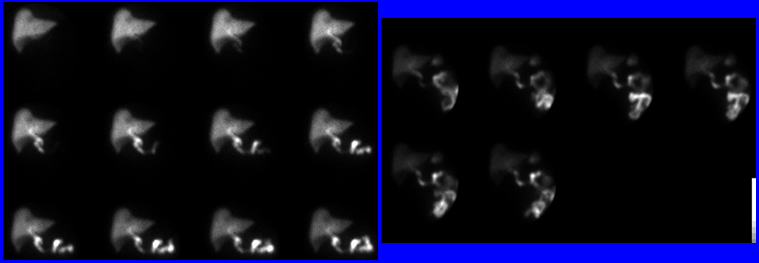
There are two scans of two different infants that underwent a hepatobiliary scan for the assessment of biliary atresia/neonatal hepatitis. 1) Define the corresponding disease. 2) Identify the preparation required before the hepatobiliary scan is administered.
Case 15
This is an example of the dynamic acquisition to assess gal bladder ejection fraction. Kinevac is administered for 1 hour. ROIs are drawn over the GB and a time activity curve is generated. Based on the information generated does the patient have acalculous cholecystitis?
For a review of this material you may also look at a Hepatobiliary Imaging presentation that is also available through SNMMI
Please not that most of the links that document the images in this presentation are no longer active.


 3
3
 1
1


 &
&