Skeletal System
An Assessment on Image Quality
- Technical considerations
- Prior to imaging the patient should drink at least 1 liter of fluid (water)
- Approximately 50% of the dose is eliminated through the kidneys in 3 hours
- An excessive fluid flushes the radiopharmaceutical out of the soft tissue
- Result - Improves target to background
- Increased intake of fluid causes the patient's bladder to fill with radio-urine
- Activity in the bladder may obscure lesions located within the pelvis - ex. prostate cancer
- Always have the patient void just prior to imaging
- The exception might be if the area of imaging interest does not include the pelvic area. However, if the patient voids frequently, the radiation dose to the bladder will less
- If there is excessive activity in the bladder sometimes, a Tail On Detector (TOD) view may visualize lesions that are not visible from other views
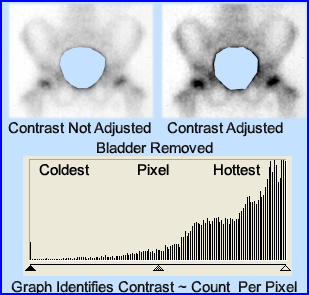
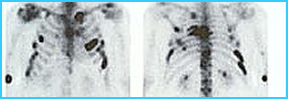
- The following images represent how a radioactive bladder might interfere with the surrounding bones within the pelvis
- The image on the left has not been manipulated or adjusted
- The image on the right has had its contrast enhanced in hopes that it will give a better display of the bony tissue
- Note- enhancement does not improve image quality!
- The graph shows why - Counts are being "pulled" to the upper end of the gray scale because the urinary bladder is HOTTER than the surrounding bone. This makes it difficult to adjust contrast. If you can eliminate those excessive counts that are coming from the bladder, then the hottest counts would come from the bone. Doing this will improve image contrast in which contrast enhancement can be applied
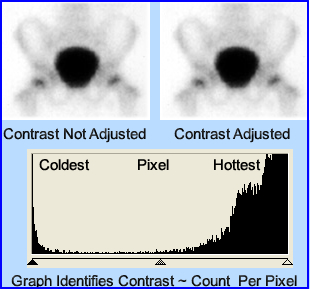
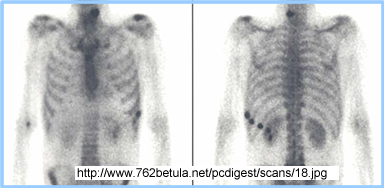
- The next set of images shows what happens when you remove the bladder counts
- The image on the left shows no contrast enhancement
- The imaging on the right has been adjusted for contrast
- Notice how the graft's grayscale has been altered via a greater "spread" of the higher end counts (grayscale was assessed with Photoshop)
- Sometimes the radioactive bladder should not be removed. Doing so may cause bony tissue that contains disease. In this case, if the patient cannot void, catheterization may be required. Considered this a "last resort."
- When does catheterization become an alternative? - men with prostate cancer may have difficulty in eliminating a significant volume of urine since tumor or enlarged prostate partially blocks the urethra. Hence placing a catheter into the patient becomes the only alternative. This may be uncomfortable with patients that have an enlarged prostate
- Discussion on contrast enhancement - displaying the acquired results
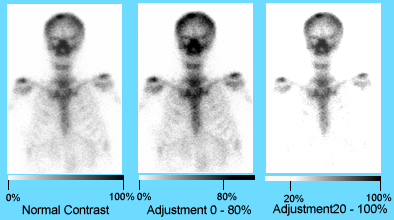
- Normal contrast is identified in the far-left image. The gray scale is set from 0% to 100%. This means that the pixel(s) with the least number of counts is/are set to 0% (white), and the pixel(s) that have the highest counts are set to 100% (black). Those pixels between 0 and 100 percent represent variations in shades of gray. Hence, count density is based on counts in each pixel. This relationship is considered linear, however, gray scales can also be modified to be either exponential or logarithmic (more of this type of information will be covered in your instrumentation class)
- The middle image shows what happens when you bring your contrast down to 80%. This means that any pixel having 80% or greater counts are set to 100% (black). This may improve the visual interpretation of a study that has low counts.
- However, in certain cases, it can make a lesion disappear, especially if the activity is around tissue is in the 80 to 100% range while the lesion is at 100%.
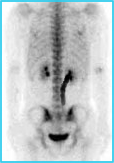
- Notice the lesion seen in the skull. What happens when the grayscale is adjusted downward? The lesion becomes partially masked, blending in with the surrounding bone tissue.
- The far-right image shows us what happens when you adjust the grayscale in the opposite direction. Bringing the low end up to 20%. This means that all pixels that have 20% or less counts will appear white (0%). This type of contrast can assist the physician in removing a significant amount of background.
- On the negative side, this adjustment could make pertinent data disappear or even make a lesion appear when there isn't one. In the case above what happens?
- How can a reduction in gray scale cause a false lesion?
- What should be realized is that his technique improves image quality, but it can also falsify create data (lesions), hiding lesions, or remove critical pathology
- To better understand this concept is important to understand the relationship between the shades of gray and how they affect contrast, in nuclear medicine
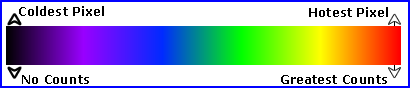
- Typically, in nuclear medicine images, there are 256 shades of gray that would compose a " color" spectrum (except there is a blend of just black and white). Changes in gray are related to the counts in an image at the pixel level. This relationship helps to assess the patient's physiology and the discovery of possible disease
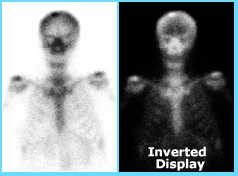
- Based on the image below, the maximum number of counts per pixel is black and the least amount of counts per pixel is white, based on the grayscale above
- In addition a grayscale can be inverted where the hottest pixels become white and the coldest become black, as noted in the display
- Grayscales can also be converted to a color scales, where varying types of color represent a variation in the amount of counts per pixel.
- There are many different types of color scales available in nuclear medicine. This may also be referred to as different color tables
- Consider 256 colors of gray with the variation of counts per pixel ... Now blend in the color spectrum, ROY G BIV. Imagine how many additional "shades" can be added and correlated to pixels density
- Using different color tables may improve the physician's ability to better evaluate disease. Changing from one color table to another may:
- Be of personal preference and/or
- Improve/enhance the clinical data being displayed
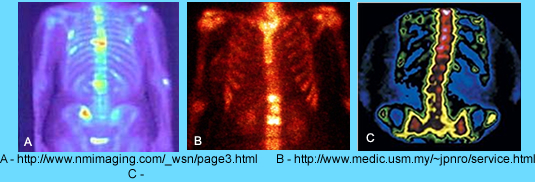
- Refer to the three examples below
- It should be obvious that gamma rays do not display color, however, color represents changes in pixel density. The above three images represent three different color displays known as color tales
- Image A, anterior bone scan, correlates to the the color scale (graph) above. Pixels start to change color from black/purple (low counts) to orange/red (high counts). Therefore, the positions of the image that displays yellow/red have the greatest amount of counts possibly representing some type of abnormality.
- Likewise the lack of uptake, black, within the bone, may also represent some type of bone abnormality.
- To give you a second example, the color table/scale above, is often referred to as the "Hot" scale. In this case. there are only four colors: black, red, yellow, and white. This color table/scale is displayed in the bone scan labeled B
- There are many types of color scales (tables) click here
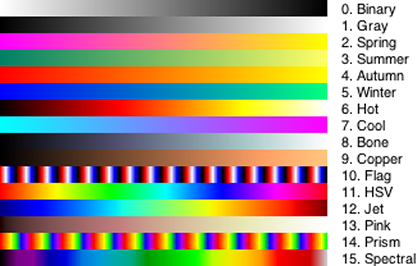
- Given the above color tables, where would you place the pixels that have the greatest amount of counts? Where would you place the pixels with the least amount of counts?
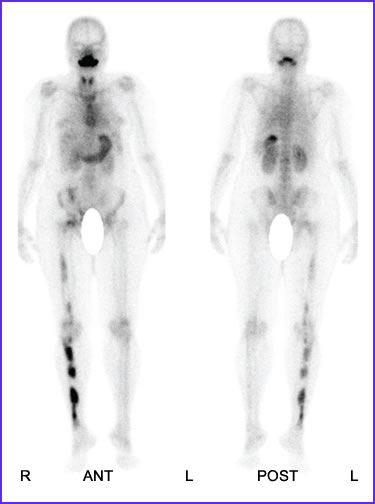
- Distances and body habitus
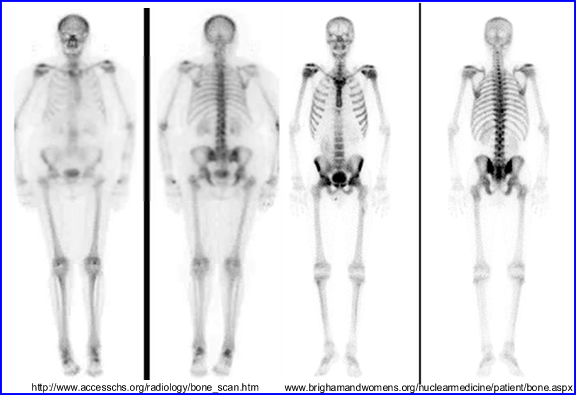
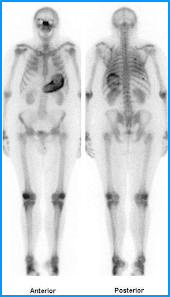
- The patient to the left is significantly overweight (estimated wt. 250 plus lbs), while the two images on the right is a patient who weighs about 170 lbs. What differences do you see? Why is there such a variation between the two sets of images?
- Points to consider
- Distance - The larger the habitus, the greater the distance
- This causes an increased attenuation and scatter
- in addition, subcutaneous fat further increases attenuation and scatter since the gamma rays have to go through it
- In this situation, what can be done to improve image quality?
- Reducing the imaging distance between the detector and the patient
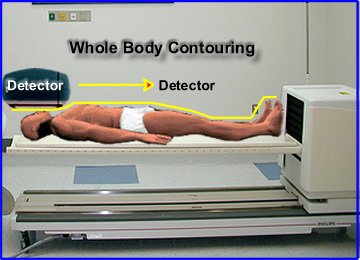
- Whole body contouring is available on many whole body imagers. As the camera scans the patient, it moves up and down along the patient, following the contour of the body, as demonstrated above
- Reducing the distance between the patient and the detector improves resolution by decreasing scatter
- The same can be said with static images ... move the detector as close to the patient as possible
- In SPECT imaging, the contouring concept can also be applied. If it is not available usually an elliptical orbit is preferred over a circular orbit. Can you see why this statement is true?
- Whole body imaging vs. spot views
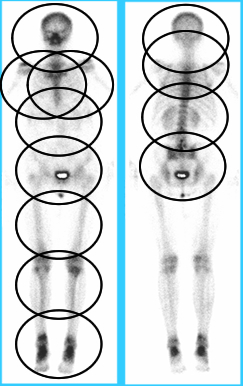
- The amount of spot views required to display a whole body format depends on the size of the detector. The goal of doing whole body via spot views is to acquire data on all the bone anatomy as noted above
- The smaller the detector, the greater amount of views are required
- An issue - If you increase the size of your detector and you acquire an image with the same amount of number of counts (ex. 500 static image), the larger scanning area covers more bone. The net result is less counts in a larger field of view. This is important concept if you want to keep the same count density (counts/pixel)
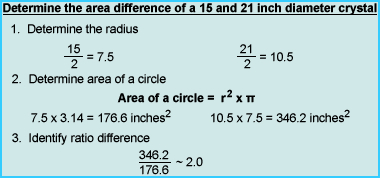
- In this example, a 15-inch detector requires a 500k image view of the chest, however, if a 21-inch detector is used, then twice the number of counts are needed, as noted in the calculation above
- Collimation
- Low Energy collimators are always applied to this procedure if one considers the energy level of technetium
- The other question you might as, "Should you use a high resolution (HR), ultra-high resolution (UHR), or a general all-purpose (GAP) collimator?"
- The above shows septa in relation to GAP, HR, and UHR. Compare true counts to scatter. Which gives you the highest number of true counts?
- An increase in scatter counts reduces increases contrast and reduces effects image resolution
- When applying the UHR collimator, you must increase your acquisition time in order to maintain the same count density as compared to the HR collimator. Hence the UHR improves resolution at a cost of increasing your imaging time
- Matrix size
- The amount of pixels in an acquired image is another important concept that relates to image resolution. Along with this concept, one must also consider the type of collimation
- Generally, it should be stated that the greater the number of pixels, the better the resolution
- However, you must also consider the type of collimator
- Review the table below to compare the matrix, counts, image type, and collimation. Note that there are exceptions to the following:
| Matrix Size |
Counts |
Image Type |
Collimation |
| 32 x 32 |
Low count |
Flow study |
LEHS/GAP |
| 64 x 64 |
Low count |
Flow study/SPECT |
LEHS/GAP/HR |
| 128 x 128 |
Moderate count |
Static/SPECT |
GAP/LEHR/Pinhole |
| 256 x 256 |
High count |
Static |
LEHR or ME/HE |
| 256 x 1024 |
High counts |
Whole body |
LEHR or ME/HEGap |
| 512 x 2048 |
High counts |
Whole body |
LEHR |
- Key - Low count, dynamic studies require a smaller matrix size and high count, static views require a larger matrix
- Next semester we will also apply counting statistics, which is yet another variable to apply in generating a quality image
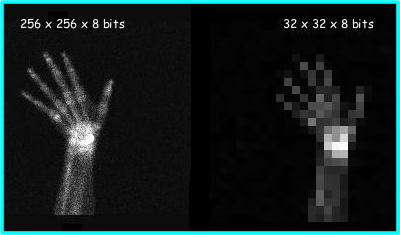
More on pixels
- This is an example of how increasing the matrix size improves image resolution, however, both images have the same amount of counts. Here is another example
- 8 bits = 1-byte and 2-bytes = 1 word
- Older imaging systems had a bit depth of 1-byte (28= 256 counts) while newer systems have pixel depth of 1 word (216 = 16.5k counts)
- What happens within a pixel if 1 byte pixel depth reaches 256 counts plus one?
- Can you conclude that a pixel depth of 216 counts is a preferred acquisition method?
- One other fact to keep in mind ... If a 256 by 256 matrix does not have a lot of counts, then there will be significant count variation between each pixel. This may cause an imaging artifact that has been generated by image noise. The role of counting statistics in nuclear medicine will be discussed, in detail, next semester. For now, keep in mind that the fewer the counts, the greater the variation, the greater the amount of noise
- Other technical considerations
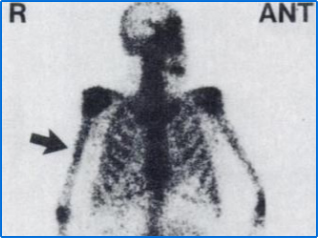
Urine or Bone Lesion?
- Urine on skin or clothing creates a lesion type artifact that may appear in the bone. What can a technologist do to prove or disprove this lesion?
- As stated earlier, hydration improves the quality of the scan by improving target to background. However, you need to look out for radioactive urine
- Patients with poor renal function may require longer delay time before imaging - why is this statement correct?
- Diabetic patients with osteomyelitis may require a 24-hour delay. This is referred to as the fourth phase in a three-phase bone scan. Why might delayed static images improve our diagnostic capability?
- Series of spot views instead of completing a whole body bone (WBB) scan. Consider the following approach:
- Start by setting your first image that has the greater number of normal counts. Usually anterior chest or posterior pelvis
- Determine how many counts should be in the initial image. Example 750k chest view
- Set all other acquisitions to the time required to take the first image. This approach is known as preset time
- Take all required spot views at the preset time
- This will adjust the grayscale to the image with the greatest counts
- Reminder - If the initial image is the pelvis, make sure that the urinary bladder is empty
- Bone imaging - formats and acquisition
- Whole body imaging requires a scan speed setting (ex. 16 cm/min or less). What happens to count density as you increase or decrease your scan speed?
- Different ways to take spot view:
- Use preset time (note above)
- Set all views to a certain number of counts central skeleton, example - 750k counts. Acquire fewer counts when imaging the appendages, example 300k
- Set time for all spots to a certain amount of time, example 5 minutes per acquisition
- Using information density which is set a certain amount of counts per cm2. To set this up you must know how many pixels are in cm2
- What is information density? It is the amount of counts in cm2. If you do this you must calculate the number of pixels in the cm2
- SPECT - Consider time/stop and how many stops
- Pinhole - very slow count rate. Usually looking at specific bone structure (ex. head of the femur)
- Flow study - 2 - 3 seconds per frame. Apply this as part of a three-phase bone scan
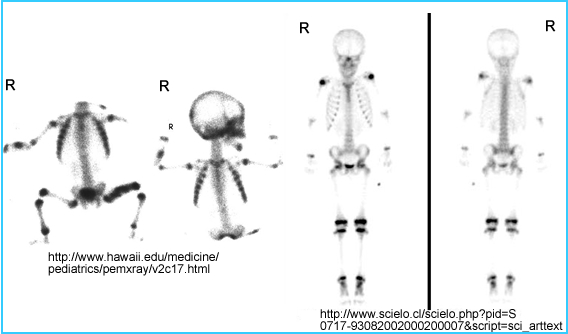
- Radiotracer uptake varies with the patient's age
- Infant through 21 years of age
- Whenever there is bone growth, increased uptake will be noted (ex. epiphysis)
- Cartilage will appear hotter than regular bone. Why is this?
- Consider bone disease where there is bone growth. Would this cause difficulty in identifying disease?
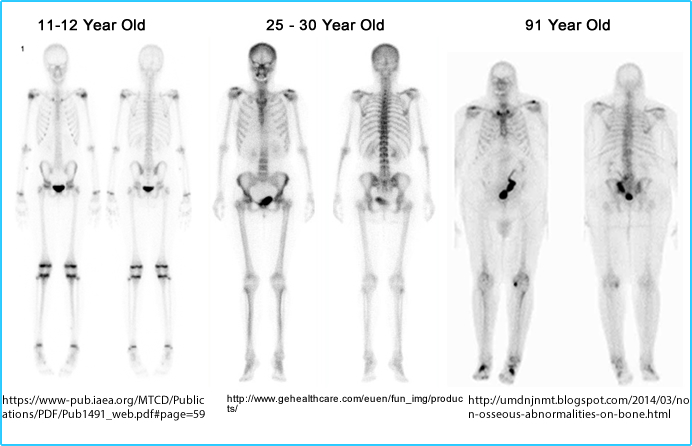
- From 21 years through 50 to 60 years
- In general, high quality bone imaging is attained with radiotracer uptake
- The main exception to this rule is if the patient is excessively overweight or their kidneys are compromised
- Sixty plus years
- Reduced tracer uptake results are usually a result of lower bone density
- Focal areas of increased uptake may also occur in articulating processes (arthritis)
- The Body is bilaterally symmetrical; hence, asymmetry in a bone scan may indicate disease
- Random increased in uptake in ribs is usually metastatic disease in nature
- Increased uptake that displays a pattern on the ribs is usually trauma (ex. MVA), whereas mets appear randomly
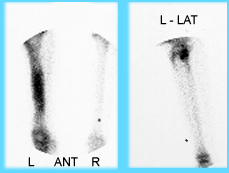
- If urinary tract obstruction is suspected or seen
- Ambulate the patient and re-image upright and have the patient go to the bathroom and ask them to void
- If this fails, one might consider a Lasix bone scan
- The key here is that you want the urine to wash out of the renal pelvis and ureters
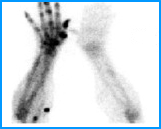
- A patient with a "hot glove" (increased uptake in the hand) is an indication that the tracer has been injected into an artery instead of a vein
- 99mTcMDP is sensitive to O2 and causes re-oxidation of 99mTc
- Do not inject air into the MDP vial
- Injection of air will cause the MDP to dissociate with 99mTc causing free technetium
ttps://memorang.com/flashcards/251661/NM<
- If this happens, you will see an uptake in the stomach, thyroid, kidneys, and choroid plexus
https://www.ijnm.in/viewimage.asp?img=IndianJNuclMed_2017_32_2_137_202237_f1.jpg
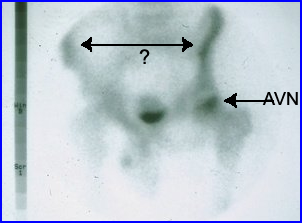
- Seven percent of patients have asymmetrical uptake of their deltoid tuberosity located at the proximal area of the humerus
- Make sure that the patient is not rotated (even slightly) when imaging a spots view or completing a WBB. This causes asymmetry and may result in an incorrect diagnosis. As an example, AVN is noted in the left femoral head, but what about the pelvis? Doesn't the left side look "hotter" than the right?
- Attenuation concerns
- Have the patient empty all their pockets.
- Remove belt buckles and jewelry.
- If the patient has a breast prosthesis ask her to remove it
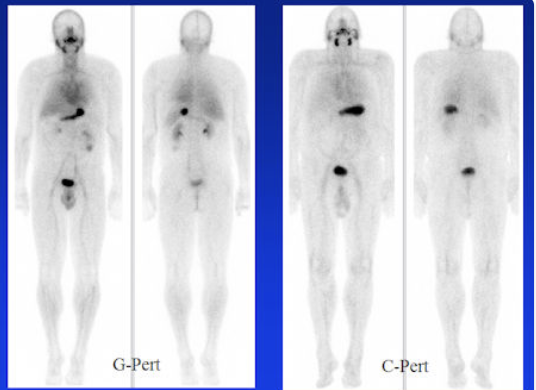
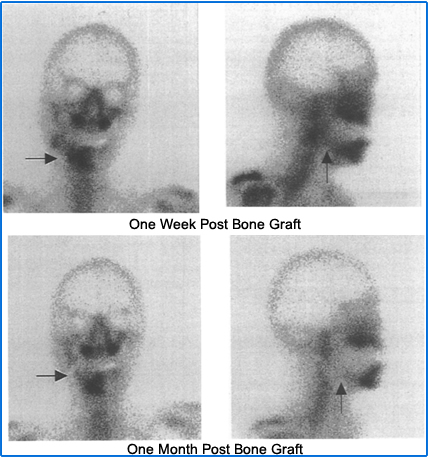
- Bone viability - Graft can be analyzed. In this case, part of the mandible was diseased and necrotic. Surgically, part of the patient's rib can be removed to replace the disease mandible. At 1-week post-surgery, increased activity is noted in the bone and viability is identified. However, 1-month post-surgery a cold stop is discovered indicating a loss of blood flow resulting in non-viable bone tissue
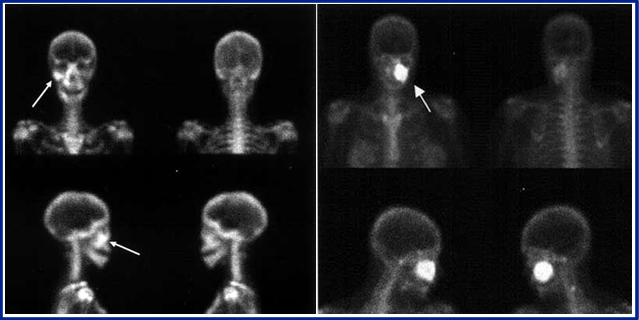
- If the patient has had a recent visit to the dentist, there may be some abnormal uptake in the mouth. Here are some examples of abnormal bone activity in or near the jaw. Several examples are given below
- The image on the left is osteomyelitis that occurred after a tooth extraction
- The image on the right is osteosarcoma in the left maxilla
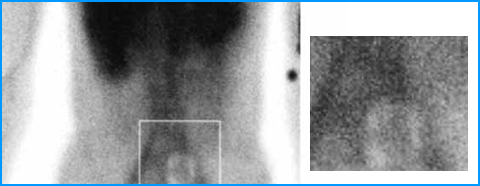
- Serendipitous findings
- Renal disease - Lack of renal uptake or renal obstruction
- Soft tissue uptake (focal) - may indicate calcification or tumor
- Stomach uptake for Rolaids - I've only heard this on but have never read about it. In the case below stomach uptake this is more likely due to Hyperparathyroidism. Hyperparathyroidism without soft tissue uptake can also be noted
- Dosing guidelines according to the SNM
- Average adult dose = 20 - 30 mCi (740 - 110Mbq)
- Obese patients = 300 - 350 μCi/kg (11 - 13Mbq/kg)
- Pediatric patients = 250 - 300 μCi/kg (9 - 11
MBq, minimum of 1 - 2.5 mCi, and the maximum should not exceed the adult dose
Types of Imaging Procedures
- Three Phase Bone Scan
- Any bone scan must begin with assessing the patient's history. Here is an example of that document.
- Dynamic (flow) - set to 3 seconds per frame for 1 - 2 minutes
- Pooling (early or immediate)
- Set at 300 - 500k per image on appendages
- Set to 700 - 1000k per image in the central skeleton
- Delays (3 hours)
- If there is significant background, wait at least one more hour or longer to take your delayed images
- Diabetics generally have poor circulation in their legs and may require additional delay image(s)
- Static images should be set at
- 300k for appendages
- 500 - 1000k for central skeleton
- Fourth phase - take additional delays up to 24 hours. If a 24-hour image is taken, the acquisition time maybe set to 20 minutes. Why?
- WBB scan
- Requires a large field of view camera
- If the camera has a "smaller field of view (FOV) a collimators may have a diverging septa towards the end of its collimator. This may allow the acquisition to include shoulders/arms/hands
- The dual headed camera is more efficient than a single-head because it cuts the imaging time down by half
- A two-headed detectors should images the entire body, anterior and posterior in a single pass
- It is usually acquired at a scan speed of 12 -16 cm/minute or less. Does resolution increase when the scan speed is faster?
- Either the table will move or the detector. Which one requires less space?
- Whole body contouring improves resolution
- Images collected are then displayed in whole body format
- "Cutting out" excessive/unwanted activity improves the gray scale (ex. bladder and injection site) - see above
- If a spot view is needed from WB images, some clinics might "cut out" the spot view from the whole body image. This is not a good idea because it will give you a lower count image. A high count image should be taken if a spot view is required. This will improving image resolution
- Increasing distance (patient to detector) significantly reduces resolution. What cause this?
- The smaller the detector head, the more images will be required if whole body spot views are taken - see above
- Spot views or limited bone scan
- Most bone scans image the entire body
- If the camera does not have a whole body format, then spot views must contain views of the entire skeletal system
- Feet, hands, wrists, and elbows may be excluded unless these are areas of interest
- A limited bone scan would include a specific area of interest - limiting the imaging area
- A limited bone scan may actually be a three-phase bone scan. If necessary, go over the patient's history and call the referring physician if you think a 3-phase is required. You are not allowed to change the order just because you think it’s the right thing to do
- Pinhole image of the bone
- A pinhole collimator may be used to magnify specific areas of interest (head of the femur, patella, or bones in the feet or hands)
- In order to attain a high-resolution image, the acquisition will take a long time'
- Consider the inverse relationship between resolution and sensitivity
- Pinhole images result in a low count image that magnifies the area of interest
- Example from a previous lecture - Note the difference in resolution between the spot view and the pinhole image
- SPECT Bone
- It should be used when the bone disease is contained within overlapping bone (ex. spine or mandible)
- A WBB scan may look normal in the spine and show a hot spot in a vertebral body when SPECT is used
- General comments on setting up a SPECT bone
- Radiographs vs. nuclear medicine
- Bone scanning is usually more sensitive in picking up disease within the bone
- Nuclear medicine identifies metabolic change while x-rays identify anatomical change
- When does an x-ray or bone scan appear positive?
- 25 - 30 percent tissue change will show a positive bone scan
- 45 - 50 percent tissue change in bone tissue appears positive on an x-ray
References
Incidental Demonstration of a Bladder Diverticulum by Tc-99m MDP Bone Scan by Fan, Yu-Ming, et al. ANN NUCL MED SCI 1998, VOL 11, No. 4