Gastric Esophageal Reflux
- Disease
- Gastroesophageal reflux disease (GERD)
- Results from episodes of gastroesophageal reflux (GER)
- Reflux esophagitis can cause mucosal changes and result in inflammation, hyperplasia, and erosion. This is the secondary effect caused by GER
- GER
- When reflux is in the esophagus it usually clears quickly
- However, in the presence of acid (from the stomach), reflux clearing will take several minutes
- It is saliva that neutralizes the acid in which reflux will then pass back into the stomach
- GER is not usually caused by one single factor, and reflux may be due to
- Increased acid and/or pepsin will cause GER
- Inappropriate peristalsis of the esophagus
- Delayed gastric emptying
- Esophageal epithelial resistance
- Hiatal hernia
- Reduced or relaxed lower esophageal sphincter (LES) pressure will also cause reflux into the esophagus, however, this will not occur if LES baseline pressure is above 10 mmHg
- Symptoms include heartburn, chest pain, regurgitation, and sour breath
- Gastroesophageal Reflux Procedure
- Patient should be NPO 12M, prior to the exam
- Preparation of the "atomic cocktail"

- 150 mL of orange juice
- 150 mL 0.1 N HCl
- 300 μCi of Tc99mSulfur Colloid
- Acquisition parameters
- 64 x 64 matrix
- Nine 30 second images are required
- Collimation LEHS or LE GAP
- Acquisition
- The patient is then instructed to drink the acidified orange juice and should then be placed in a supine on the imaging table
- An abdominal binder is then placed around the patients abdomen (large blood pressure cuff)
- Camera is placed with the stomach at the lower end of the imaging field
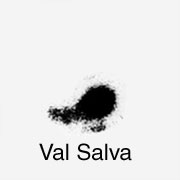
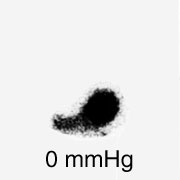
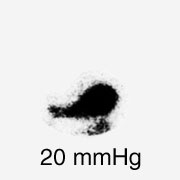
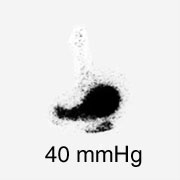
- The following images are then taken at 30 second intervals: Pre-Valsalva, Valsalva, (and then each image requires an increase of pressure applied via the abdominal binder) 0 mmHg, 20 mmHg, 40 mmHg, 60 mmHg, 80 mmHg, 100 mmHg, 120 mmHg
- If reflux is seen before the end of the procedure, the remaining images do not need to be acquired
- Analysis of acquired data
- Visual interpretation will identify activity in the esophagus indicating a positive study
- Using the above formula, ROIs can be drawn around the stomach at 0 mmHg and the esophagus (in all images)
- If the activity is ≥ 5%, then quantitatively the study is considered positive
- Case presentation
 |
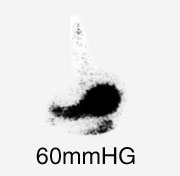 |
The above case shows some of the images collected in a gastroesophageal procedure. Activity in the esophagus appears on the 40 mmHg image indicating a positive study. No quantification analysis was completed in this exam.
Return to the beginning of the document
Return to the Table of Contents