- There two basic types of salivary glands
(major and minor)
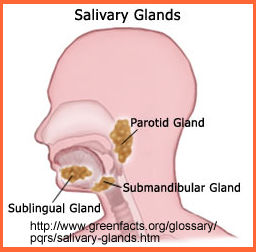
- There are three major pairs of gland - parotid, submandibular, and sublingual
- There are hundreds of other minor glands found through out the mouth cavity
- Each salivary gland contains two regions
- Acinar region
- responsible for the secreting either serous or mucous
- Parotid - serous
- Sublingual - mucous
- Submandibular -serous and mucous
- Minor glands - mucous
- This region is water permeable and the site of all salivary production
- Glands secrete about 85 - 90% exocrine protein into saliva that is mostly isotonic fluid
- Ductal region
- Pathway for serous or mucous to pass from the gland into the oral cavity
- Water cannot permeate the ducts
- Reabsorb NaCl
- Ducts secrete about 10 - 15% exocrine protein in a hypotonic solution
- Salivary glands aid in digestion (starch) and swallowing
- The saltine cracker test is an example on how important saliva is in the aid of swallow
- If all the saliva is absorbed in the oral cavity, you cannot swallow solid food
https://www.youtube.com/watch?v=xGixFl0abQc - Acinar region
- responsible for the secreting either serous or mucous
- Physiology
- At rest the production of saliva occurs as follows
- Parotid ~30%
- Submandibular and sublingual ~40%
- All minor glands contribute ~30%
- During the active phase of eating the production of saliva changes
- Parotid ~45%
- Submandibular and sublingual ~45%
- Minor glands ~10%
- The amount of secretion (volume) increases 10 to 20 times more than at rest
- Salivation occurs in response to neural activation and is not considered spontaneous
- While the production of saliva will not be discussed, one must appreciate that pertechnetate replaces Cl- in the salivary production. Hence, pertechnetate is incorporated into the gland via serous production
- At rest the production of saliva occurs as follows
- Diseases
- Xerostomic (dry mouth) - cause may be known or unknown
- When administering pertechnetate salivary glands will uptake the radiotracer, but not excrete it
- Dry mouth can be caused by certain pharmaceuticals - antidepressants, antihypertensive, and/or anticholinergic
- Radiation therapy to the head and/or neck or thyroid oblation
- Sjogren's syndrome is a autoimmune diseases that more normally appears in post-menopausal women
- Evaluation of tumor mass
maybe evaluated as follows
- 70 - 80% are benign
- Smooth borders is an indication of this
- Irregular borders may identify cancerous cells
- Most tumor cells are heterogeneous
- Usually defined as pleomorphic adenoma
- Will appear cold and are not functioning when pertechnetate is administered
- Warthin's tumor (cystadenoma lymphomastosum)
4
- Is usually a functioning hot mass
- This tumor is usually benign
- In the example the parotid gland indicates tumor which displays its heterogeneous nature as indicated by the arrows. Following lemon juice (C and D) shows some response to the stimuli1

http://jnm.snmjournals.org/content/39/1/43.long - 70 - 80% are benign
- Sialoadenitis (inflammation)
- Acute phase shows increased uptake
- Over time, if this condition continues, tracer uptake is reduced as salivary glands become damaged
- Obstruction can be caused by a sialolith (stone). This can be diagnosed when pertechnetate if picked up by the gland, but the activity is not secreted
- Sjogren's syndrome
- Early development of the diseases identifies normal pertechnetate uptake with some delay in secretion
- As the disease progresses uptake becomes diminished and secretion of pertechnetate is further delayed
- At end-stage disease there is complete loss of tracer uptake
- Xerostomic (dry mouth) - cause may be known or unknown
- Procedure 1
- Dose - 5 to 10 mCi
- Collimator - LEHR
- Matrix - 128 x 128
- Dynamic - 120 seconds/frame for 60 minutes
- Image Anterior head and neck
- At 40 minutes post injection
- Administer 0.5 mL sodium citrate PO
- Make sure the patient does not move his/her head while administering
- Patient should swallow the fluid after it has been in his/her mouth for 30 seconds
- Spot views may also be taken to evaluate tumor or other structures or 1-minute dynamics can also be taken
- Qualification analysis (Uptake and Washout)
-
There are two components that are critical when evaluating salivary function
- How quickly the radiotracer is picked up by the gland - Uptake
- How much/how fast does the radiotracer excrete when lemon juice is administered - Washout
Qualitative Table for Salivary Gland EvaluationParotid Uptake (1)
0 - 6 minutes
7 - 40 minutes
>40 minutesPoints
2
1
0Submandibular Uptake
0 - 6 minutes
7 - 40 minutes
>40 minutes2
1
0Activity in Oral Cavity
0 - 32 minutes
33 - 40
>40 minutes2
1
0Parotid vs. thyroid concentration
>50%
<50%1
0Submandibular vs. thyroid concentration >50%
<50%
1
0Response to Lemon Juice
Yes
No
1
0Maximum Score 9 - Uptake
and washout (qualitative approach)
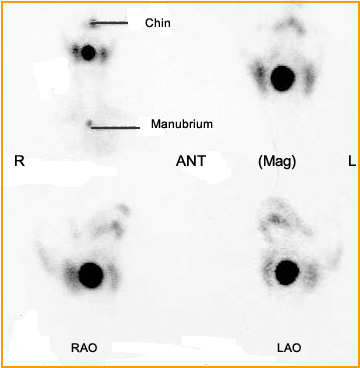
- Activity should quickly appear in the all glands bilaterally
- Tracer is usually seen in parotid and submandibular glands within three minutes post injection, but is considered normal if it takes up to 6 minutes (this is equal to 2 SD)
- Without any lemon juice stimulation activity should appear in the oral cavity in about 13 minutes, but is still considered normal if it takes 32 minutes (this is equal to 2 SD)
- In all but 6% of the population tracer uptake is greater in the thyroid when compared to the major salivary glands
- Application of lemon juice should cause washout
- Apply the above grading scale to salivary scan
- The closer the value is to 9 the better the function of the glands
- Semiquantitative2
- Acquisition protocol is similar to the one mentioned above
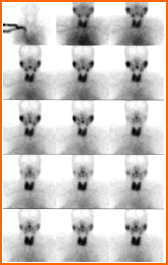
- The above images shows uptake of the salivary glands appearing over time. Five mCi of pertechnetate was administered and data was acquired in a 64x64 matrix. Images were taken every 30 seconds and at 15 minutes freshly squeezed lemon juice mixed with water was given to the patient. This occurred on frame. 2 (Not all images are being displayed)
- Homework assignment click here
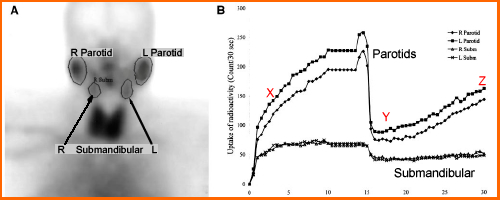
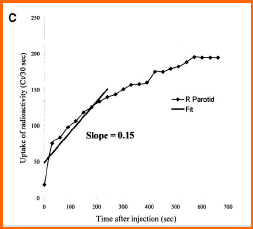
- After the data has been collected ROIs are drawn over the left and right Submandibular/Parotid glands. Time activity curves are then generated for each gland2
- X - represents the the uptake value at a point where the curve is the steepest. This value defines the slope of the curve. The more positive the slope, there better the uptake
- Y - defines washout. How much of the activity washes out of the gland after the administration of lemon juice
- Z - Curve starts to increase. Why does the behavior occur?
- Why is the activity in the submandibular glands less than that of the parotid glands?
- The above graph shows you abnormal distribution of the radiotracer. The slop of the uptake is reduces and after the administration of lemon juice there was no washout.2
- Another case5

- While this appears in another language the results are worth observing
- ROIs are color coded to better interpret the scan: green, light/dark blue, and purple are the salivary glands; red is the mouth; and black "fundo" is background
- Appreciate how there is a significant drop in salivary retention after citric acid is administered which results in a drastic increase of activity in the oral cavity
- Unusual Case study
- Patient was administered 16.71 mCi of 99mTcO4- with the following results. What do you think is being imaged?
- Hint - It migrates from the sternum
References
1. Most of lecture material was attended from: Nuclear Medicine Diagnosis and Therapy, Harbert, JC, Eckel man, WC, and Neumann, RD.Thieme Medical Publishers, Inc., NY,NY 1996
2. Quantification data was acquired from: Outfit, I, Nair, MK, and Ibrahim, AK. Salivary Gland Scintigraphy: The Use of Semiquantitative Analysis for Uptake and Clearance. Society of Nuclear Medicine, TS. 2003;31:81-85
3. Discussion of Sjogren's syndrome - A pilot study of the salivary scintigraphy diagnostic performance in a Spanish population with Sjogren's syndrome diagnosed by the European criteria
4. Diagnostic Accuracy of Technetium-99m-Pertechnetate Scintigraphy with Lemon Juice Stimulation to Evaluate Warthin's Tumor
5. Assessment of salivary gland function in Sjogren's syndrome: The role of salivary gland scintigraphy by Vinagre F., et al.
Return to the Beginning of the Document
Return to the Table of Content