|
|
Neurophysiology Laboratory of Kimberle M. Jacobs
|
|
|
Kimberle M. Jacobs, PhD PhD 1994
Neuroscience, Associate Professor
|
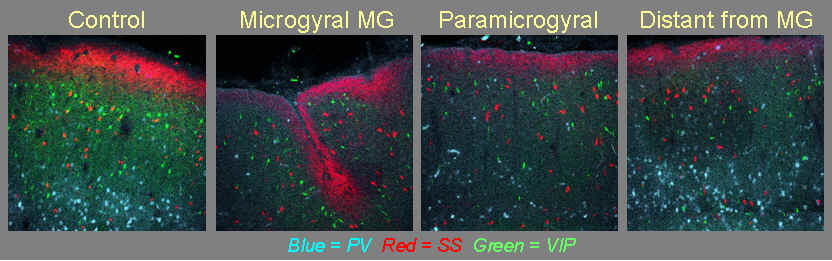
We are currently exploring the type of cellular plasticity that occurs in a model of developmental epilepsy. There are many causes of this type of epilepsy, including: a maternal virus or infection, maternal ingestion of alcohol, cocaine, or other drugs, radiation treatment, a fetal stroke or traumatic brain injury. When these occur during the birth and migration of neurons into the neocortex, they cause a structural change (malformation). Often this structural change can be observed at the level of the gross brain. Click here for a list of web pages that show examples of human malformations. This structural damage often causes seizures, but can also be associated with dyslexia, schizophrenia, cerebral palsy, and mental retardation. These developmental malformations are often the cause of the most difficult kind of seizures to treat with currently available anti-epileptogenic drugs. This is particularly true for children with seizures. Our goal is to identify the neurological mechanisms that cause the cortex to be epileptogenic after malformation. We use a rat model of the malformation of microgyria (also called polymicrogyria, see Figure 1 below). Rats normally have a smooth brain with no gyri or sulci. A sulcus can be induced in rat brain however with a transcranial freeze lesion just after birth. Rats that have this 'extra' sulcus have an increased likelihood of developing seizures when challenged with kainic acid or other agents. Recordings that show the electrical activity of populations of neurons (evoked field potentials), demonstrate this hyperexcitable state (see Figure 2 below). Recordings from single neurons (whole cell patch clamp, see Figures 3-5 below) show an increased excitatory input in the region next to the malformed cortex. Anatomical tract tracing experiments have shown that thalamic input that should have targeted the malformed area projects to the adjacent epileptiform region. In humans, seizures are sometimes delayed for weeks, months, or even years after the formation of the abnormal structure. In this rat model, there is also a delay to the onset of field potential epileptiform activity. This delay is such that no epileptiform activity is observed at 9 or 10 days of age, but nearly every brain slice from nearly every lesioned rat tested shows this epileptiform activity by 12 days of age. This suggests there is an abrupt change in brain state. The abnormal targeting of excitatory afferents to the region adjacent to the malformation appears to occur prior to onset of the epileptiform activity. There may be additional cellular changes that occur on the day of expression of the epileptiform activity. We are currently exploring changes in inhibitory interneurons. The percentage of subtypes of inhibitory interneurons varies with location in and around the malformation. There is a significant loss in numbers of interneurons that stain for parvalbumin within and around the malformation, but these neurons recover at sites distant to the malformation (see Figure 6 below, from the work of Master's student, Kim Hays). This type of inhibitory interneuron functions to control the horizontal spread of excitatory activity within neocortex (see Figure 7 below). In contrast, neurons that stain for somatostatin often control vertical or columnar activity (see Figure 7 below). These neurons are likely involved in synchronizing columns of neocortex. Increased activity of these inhibitory interneurons may produce hypersynchrony. Thus although this would be an increase in inhibition, it could still contribute to too much excitation and epileptiform activity. This type of interneuron is not reduced in and around the malformation (see Figure 6). An MD/PhD student in the lab, Mandy George, has recently shown that the synaptic input to inhibitory interneuron subtypes is differentially affected in malformed cortex. The few remaining PV interneurons that reduce horizontal spread of excitation receive less excitatory input in malformed cortex (see Figure 8 below). The SS interneurons that control columnar synchrony receive enhanced excitatory input (see Figure 8 below). We expect that the end result of the altered inhibitory interneuron systems is a strengthened vertical excitatory pulse that is then carried further than normal horizontally, due to the weakened PV interneurons. This pattern of increased synchrony and subsequent spreading of activity is typical for epileptiform activity. We can differentially activate the interneuron subtypes, since they express different surface receptors. For instance, LTS interneurons are activated by metabotropic glutamate receptor subunit 1 (mGluR1) agonists. When LTS interneurons are activated by mGluR1 agonists, they fire action potentials in a rhythmic, oscillating pattern. This rhythmic inhibition can synchronize the activity of surrounding excitatory neurons. To study columnar synchrony, Master's student, Patrick Wolfgang, has recorded field potentials within a vertical column of neocortex (see Figure 9 below). Under normal in vitro slice conditions, the mGluR1 receptors are already activated (see Figure 10 below). Blocking the mGluR1 receptor changes the shape of the field potential. Specifically the halfwidth of the field potential decreases in control cortex. This suggests that local synchrony is decreased, since cells are no longer firing at exactly the same time, the postsynaptic response is increased in length (increase in halfwidth). This happens simultaneously in superficial and deep layers within control cortex. In PMG cortex the effects are different in superficial versus deep layers. The ultimate result is a longer field potential in superficial layers than in deep layers (see Figure 10B below). Thus the mGluR1-LTS system functions abnormally in PMG cortex. We are using a system to more directly examine synchrony of action potentials, by recording multi-unit activity at three sites within neocortex (see Figure 11 below). This allows us to simultaneously examine columnar and horizontal activity and to measure the synchrony using cross-correlograms. Master's student, Patrick Wolfgang, has begun these studies (see Figures 12-13 below). Inhibitory interneurons are likely affected by malformation in a number of different ways. An undergraduate in the lab, Xuan Pham, learned to perform field potential recordings last summer. Her data suggest that inhibitory interneurons may be less effective because electrical connections between these cells are not functioning (see Figure 14 below). Overall we believe that abnormal connectivity is a major contributor to the epileptiform activity associated with microgyria (see Figure 15 below). However, this abnormal connectivity is not uniform in the subtype of cortical cellular components that it affects. Despite this, we believe it may be possible to selectively reduce the activity of the overactive LTS interneurons, using receptors found only on these cells. Proof of this requires further study (and students!). Figure 1 (below): Nissl-stained section through a region of malformed rat cortex. A transcranial freeze lesion with a day of birth produces a focal loss of deep layer cells. Neurons of the superficial layers migrate into position after the loss of these deep layers. This process is postnatal in rats, but prenatal in humans. This abnormal 4-layered pattern is typical for human polymicrogyria. The cortex adjacent to the malformation shows epileptiform activity. Even if the malformation is removed, the epileptiform activity remains.
Figure 2 (below): Field potential recordings from normal cortex and the region adjacent to the malformation. These field potentials reflect excitatory synaptic currents primarily within the apical dendrite of pyramidal neurons. The normal, graded, short latency event occurs in the malformed cortex, but epileptiform activity is also present. Epileptiform field potentials are all-or-none, show long latency after the stimulus (time of stimulus shown as circle above trace), and vary in exact latency and form.
Figure 3 (below): Visualized whole cell patch clamp experiments involve use of a microscope with a high power objective. The shape of the cell body and proximal dendrites are easily visualized with this method, allowing us to choose particular cell types. The example shown here is a pyramidal neuron, which we can tell by the presence of an apical dendrite. a glass pipette pulled to a fine tip is attached to the neuron with suction. After a seal is made, the piece of neuronal membrane across the tip of the electrode is removed with sudden suction. Now the inside of the cell is contiguous with the inside of the pipette. This allows us to clamp the cell at specific voltages, but also allows us to fill the cell with a dye - see Figure 4.
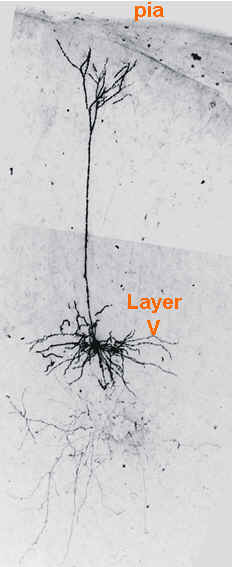
Figure 4 (below): Shows a layer V neocortical pyramidal neuron filled with the dye biocytin during whole cell patch clamp recording. the long process is the apical dendrite. This can be seen to branch near the superficial layers of this cortical slice. Fine axonal branching is present in lower layers.
Figure 5 (below): Voltage clamp recordings of excitatory postsynaptic currents (EPSCs). The frequency of the excitatory events was greater in the cells adjacent to the microgyral malformation (paramicrogyral cells).
Figure 6 (below): Shows the distribution of three distinct subtypes of inhibitory interneurons, stained immunohistochemically. Stained circles are neuronal cell bodies. Blue stain labels parvalbumin (PV), a calcium-binding protein. This protein is normally found in 30-50% of inhibitory interneurons. The staining for PV is reduced within the malformation and adjacent to it, but recovers at distant sites. Red stain labels the peptide somatostatin (SS). The cells that stain for SS are often bipolar in morphology, meaning that their dendrites extend vertically through the neocortical layers. Their axonal morphology typically shows a similar distribution, suggesting that they function to synchronize cells in different layers. Green stain labels Vasointestinal peptide (VIP). The superficial distribution of these interneurons appear to be altered throughout regions of freeze-lesioned cortex. This image comes from the work of 2007 Master's student, Kim Hays.
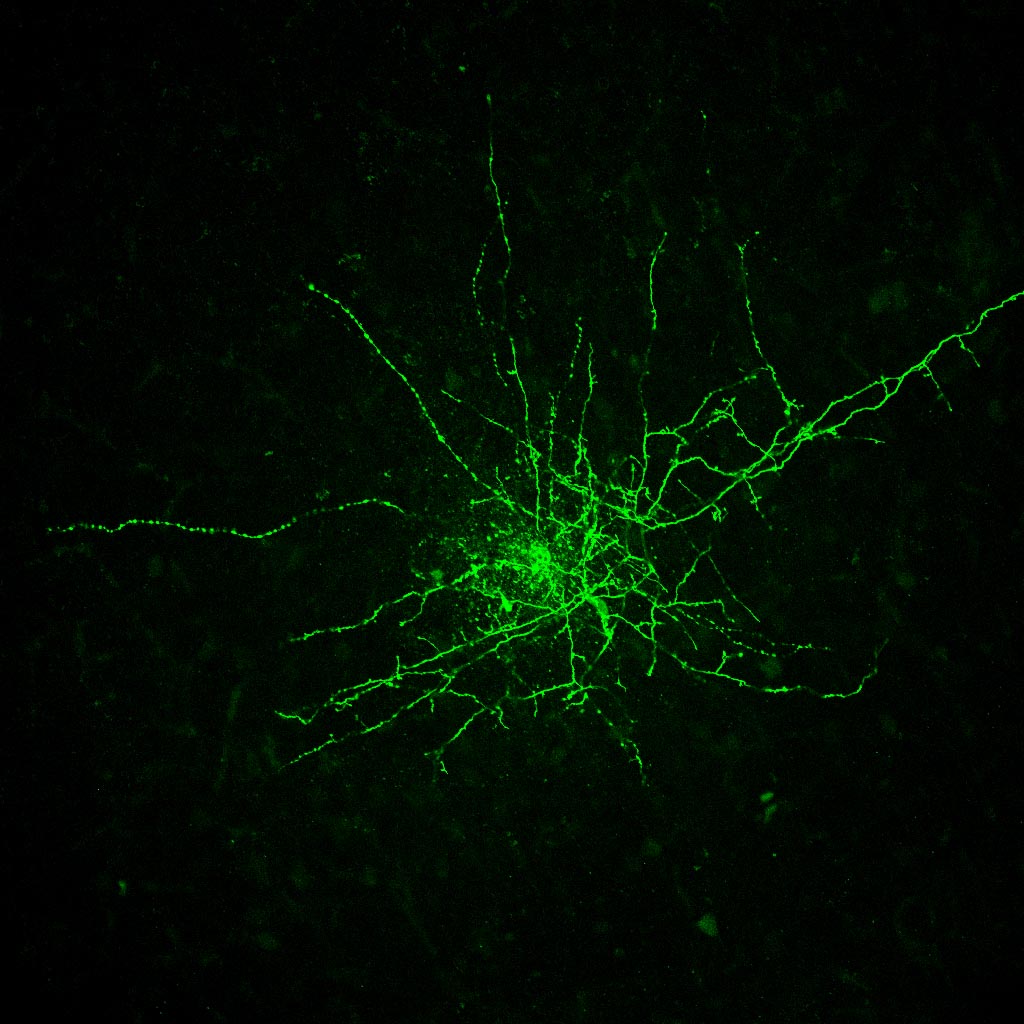
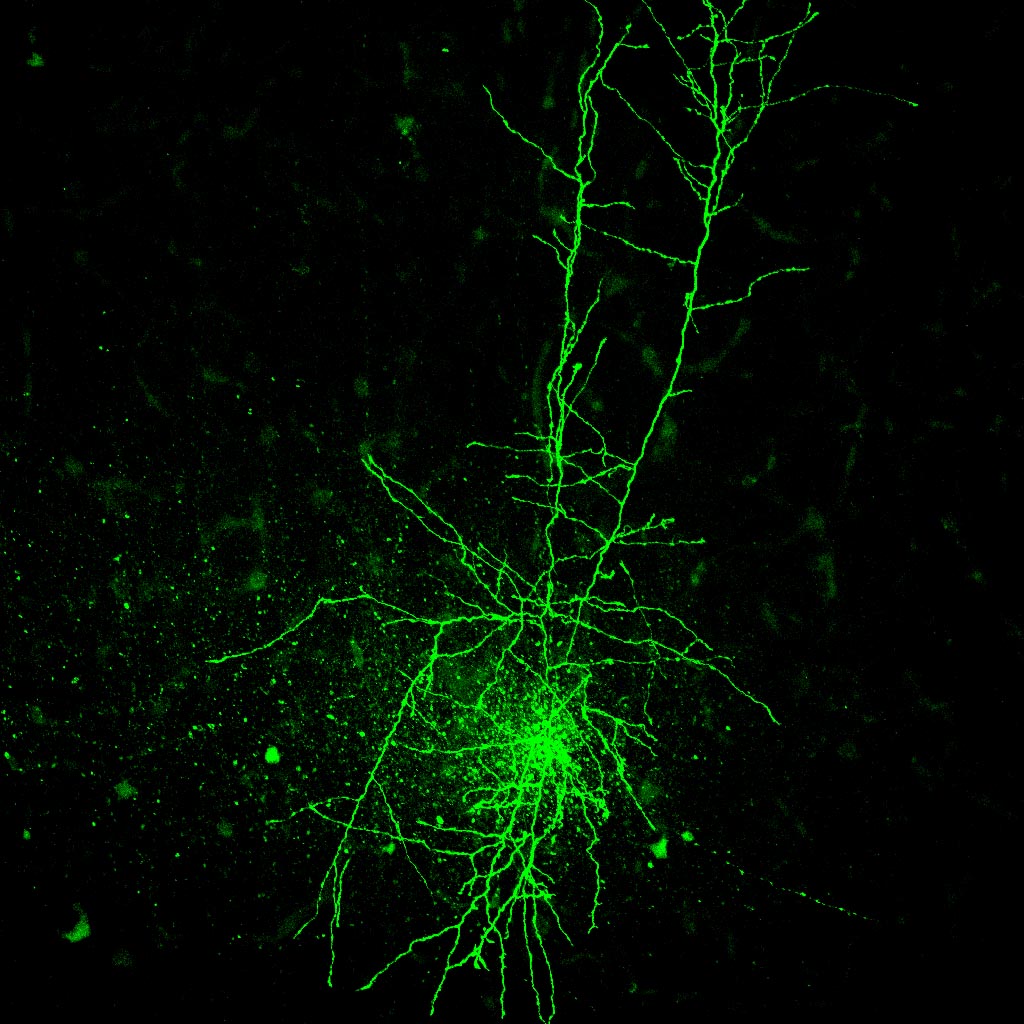
Figure 7 (below): Shows interneurons filled with the dye biocytin during whole cell patch clamp recordings. With this technique, we can correlate the morphology of the cell to its physiology. At the top is a cell that shows typical basket cell morphology. These cells often stain for parvalbumin (PV), and typically are fast-spiking (FS), and control horizontally-spreading excitation. In the middle is a cell that shows typical bipolar morphology. The dendrites project through several layers. These cells typically stain for peptides somatostatin (SS) or VIP. We believe that these cells function to synchronize activity within a cortical column. Below the pictures are recordings of the action potential firing pattern from each of these two types of cells. The FS cells have brief action potentials with a high frequency pattern. The AP firing pattern, with broader spikes and showing lower frequency, and some adaptation (slowing of AP frequency over time) comes from the LTS interneuron subtype that typically has a bipolar morphology. This figure comes from the work of MD/PhD student, Mandy George.
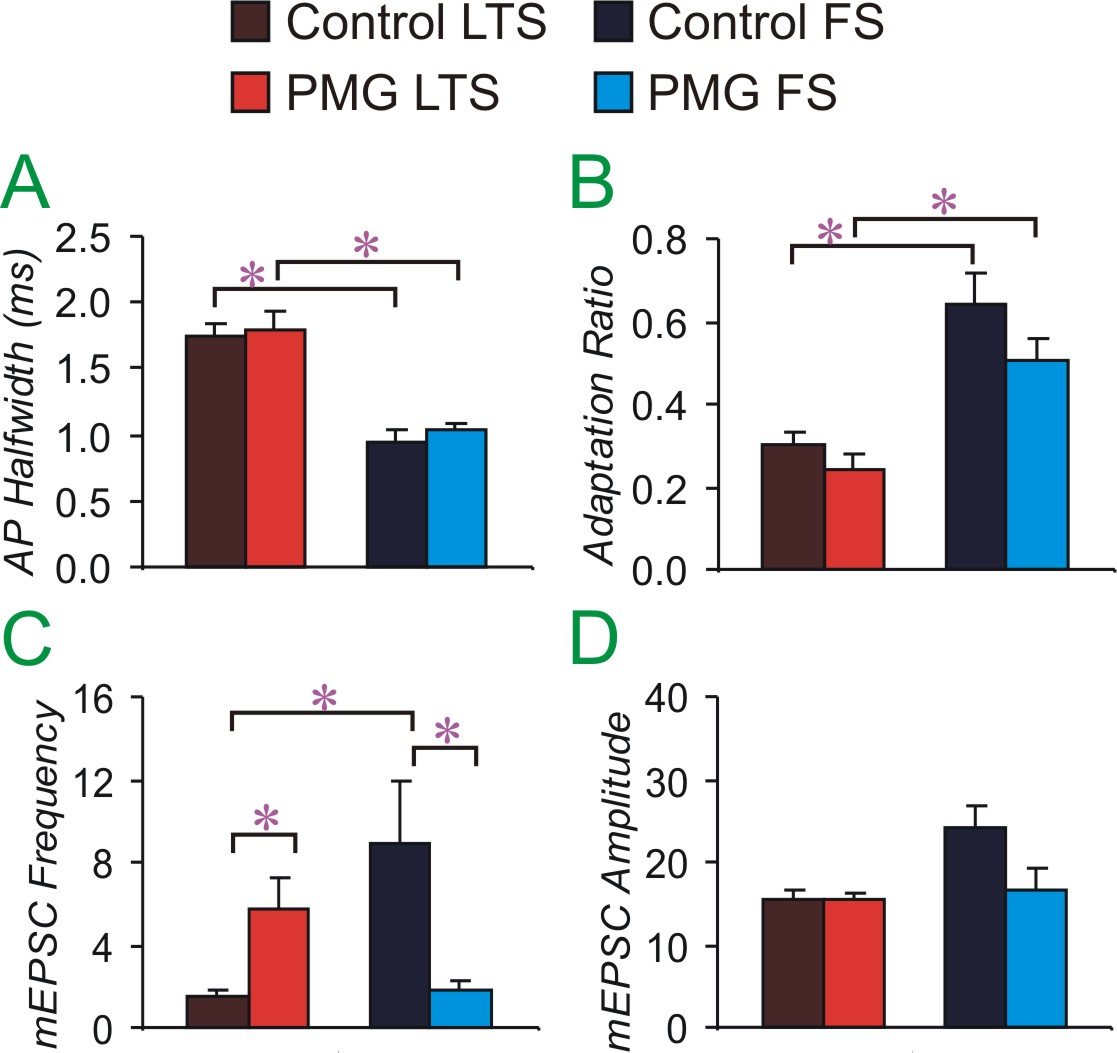
Figure 8 (below): Shows intrinsic (A, B) and synaptic (C, D) properties of two types of interneurons in control (dark colors) and paramicrogyral (PMG, bright colors) cortex. A and B show that FS and LTS interneuron subtypes vary in measures of AP halfwidth and adaptation ratio. This is true in both control and PMG cortex. Also on these intrinsic measures, FS cells are similar in control and PMG cortex. LTS cells are also similar in intrinsic properties for both control and PMG cortex. PMG differs from control cortex in measures of synaptic properties. The miniature (m)EPSC frequency is increased in PMG LTS cells compared to control LTS cells. This increased excitatory input may increase the functioning of LTS interneurons within PMG cortex. Excitatory input to PMG FS interneurons is decreased. Thus we hypothesize that these cells are less likely to be engaged and able to stop horizontally-spreading excitation within PMG cortex. This may allow the spread of epileptiform activity. The mEPSC amplitude is not altered in PMG cortex, suggesting that there is no change in postsynaptic receptors. This figure comes from the work of MD/PhD student, Mandy George.
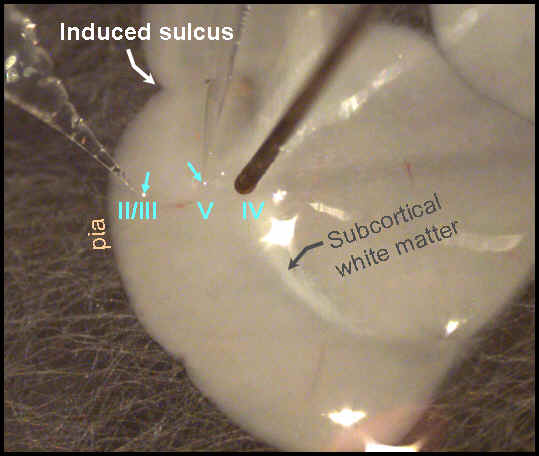
Figure 9 (below): Shows a live piece of cortical tissue. This slice is ~300 um thick and is kept alive in a special recording chamber with artificial cerebrospinal fluid (aCSF) flowing over it. Recording electrodes are glass pipettes in neocortical layers II/III and V (blue arrows). The stimulating electrode is tungsten and is located in layer VI, near the border with the white matter. All three electrodes are aligned in a column, perpendicular to the plane of the overlying pia at the cortical surface. With this arrangement, either field potentials or multi-unit activity (action potentials from a number of cells) are recorded extracellularly. This picture is from the work of current sophomore undergraduate at VCU, Xuan Pham.
Figure 10 (below): Effect of a drug that blocks metabotropic glutamate receptor subunit 1 (mGluR1). Within the neocortex, the mGluR1 receptors are found only on bipolar interneurons (those that stain for SS or VIP, and function to synchronize excitatory activity across the layers). Activation of mGluR1 receptors causes oscillations in the bipolar interneurons, which can then serve to synchronize the activity of surrounding pyramidal neurons. These graphs show the effect of this drug on the halfwidth of field potentials recorded from cortex, as shown in Figure 9. A. Shows the percent change in field potential halfwidth. The halfwidth of the field potential is an indication of local synchrony. A larger halfwidth would indicate less synchrony, since the response is spread out in time. Not surprisingly, the effect of this mGluR1 antagonist in control cortex is to reduce local synchrony, resulting in an increased field potential halfwidth. This effect is significant in deep layers, with a similar trend in superfiical layers. B. Shows the ratio of superfical layer field potential halfwidth to deep layer field potential halfwidth. Because the entire column is changing in the same way wthin control cortex, the ratio is similar before and after drug application. In paramicrogyral (PMG) cortex, the halfwidth is changing in opposite ways in superficial versus deep layers. These results suggest that activation of bipolar interneurons through mGluR1 receptors functions differently in PMG cortex compared to control cortex. This figure comes from the work of Master's student, Patrick Wolfgang.
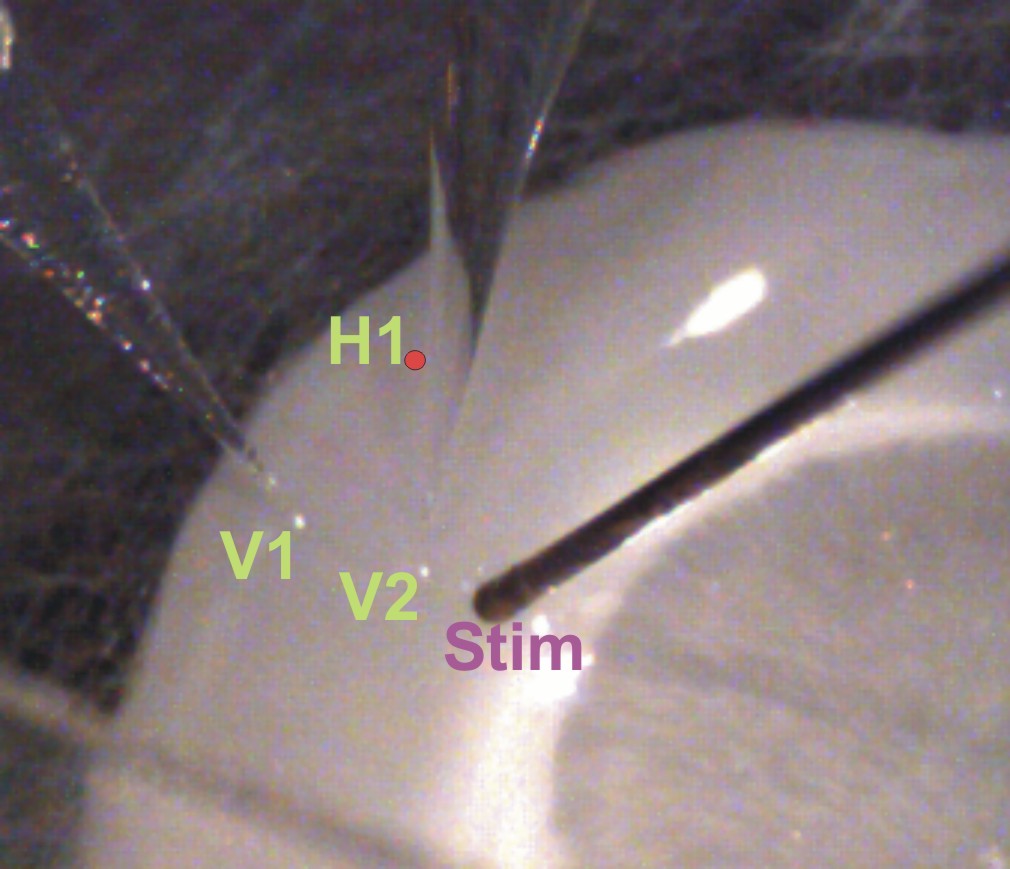
Figure 11 (below): Shows a live piece of control cortical tissue, similar to that shown in Figure 9. In this case, two glass pipette recording electrodes (vertical electrode 1,V1, in superficial layers and vertical electrode 2, V2, in deep layers) are shown in a columnar arrangement with the stimulating electrode. For recordings shown in Figure 12, there was an additional glass pipette recording electrode at position labeled H1 with a red dot. This was the horizontal electrode, directly across from V1. With this arrangement, multi-unit activity (action potentials from a number of cells) was recorded extracellularly. This picture is from the work of Master's student, Patrick Wolfgang.
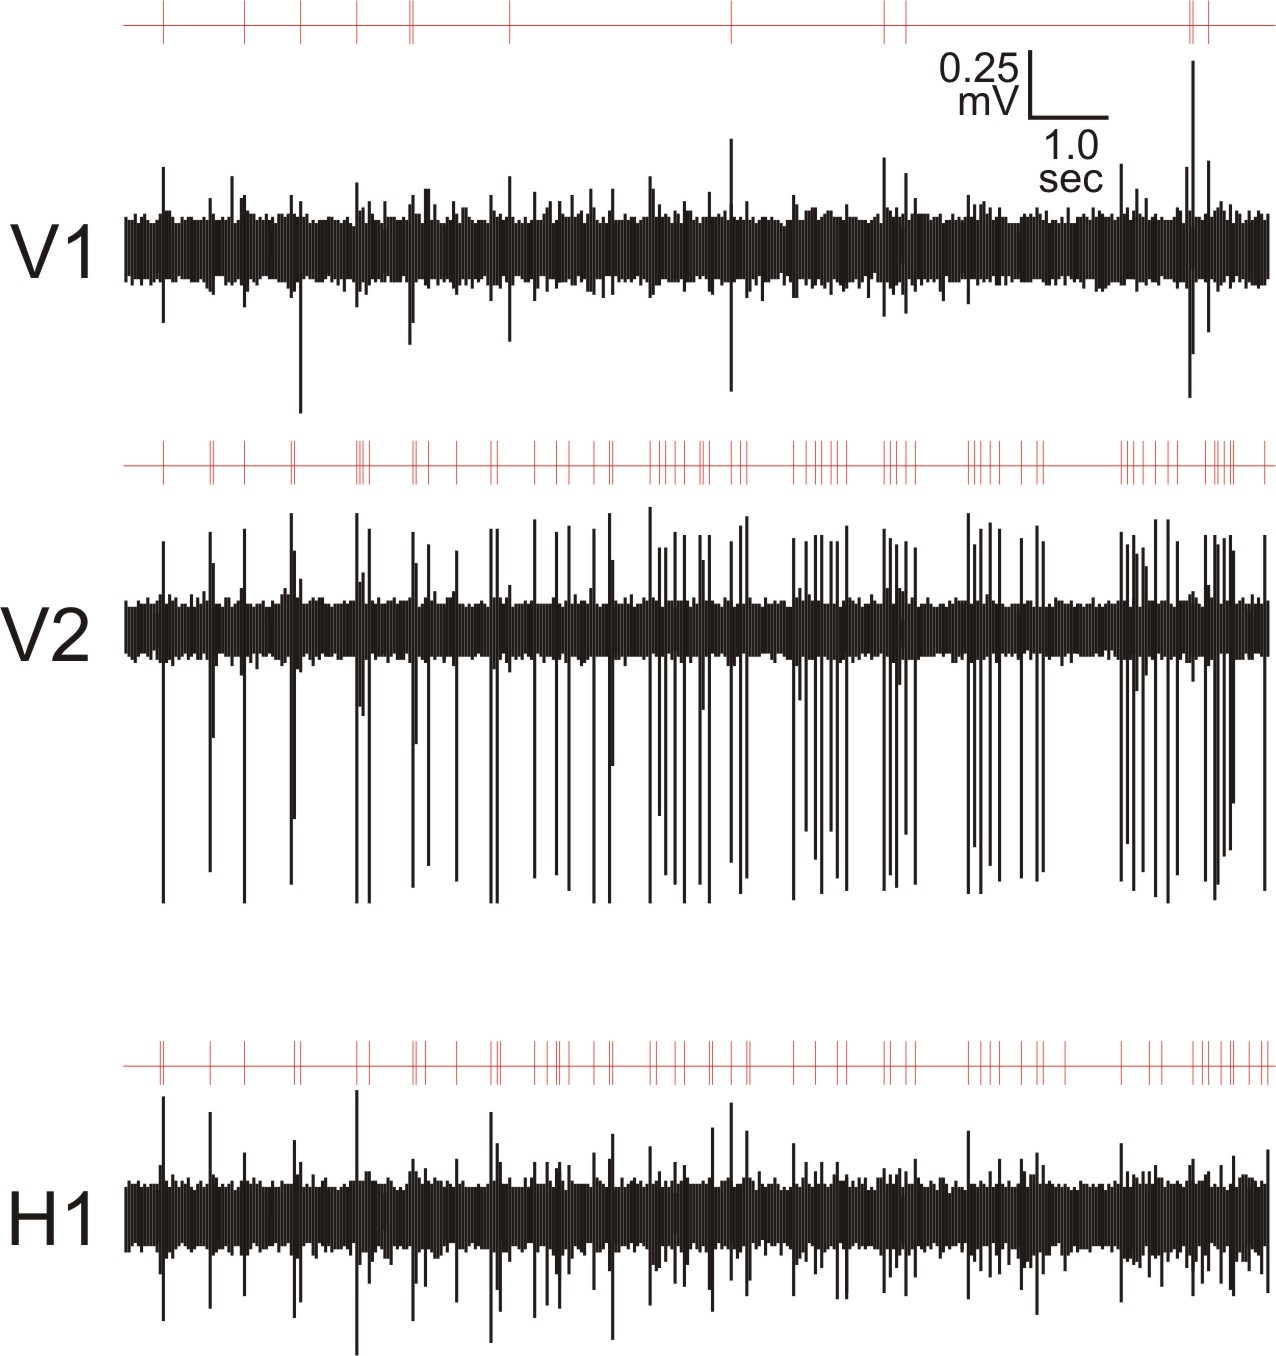
Figure 12 (below): Spontaneous activity in multi-unit recordings (shown in black), with electrodes in positions shown in Figure 11. The red lines above each multi-unit recording trace show the detection of action potential at a level above noise. This figure is from the work of Master's student, Patrick Wolfgang.
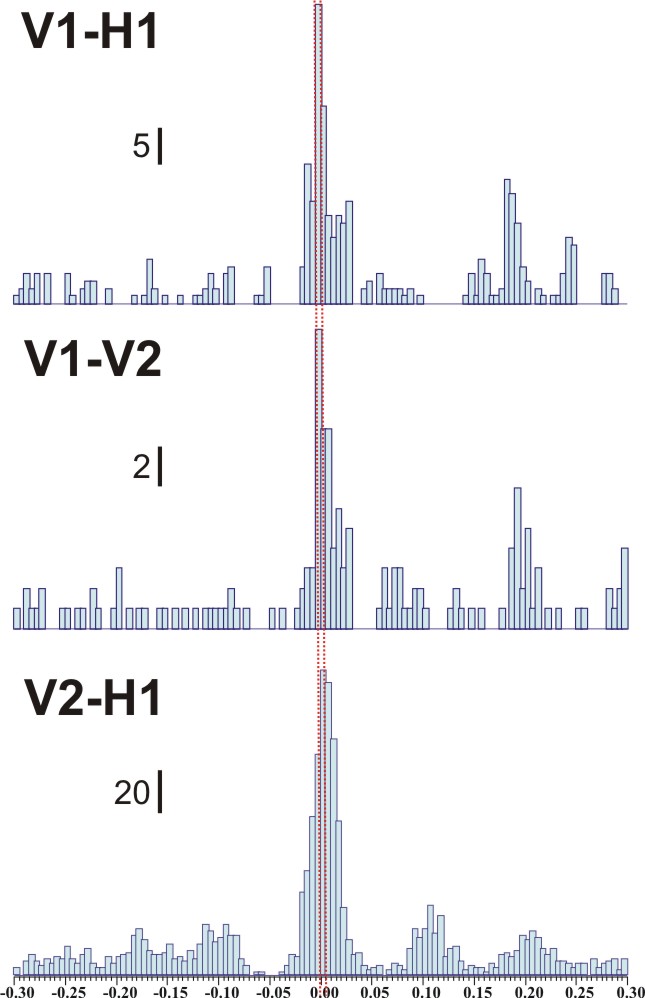
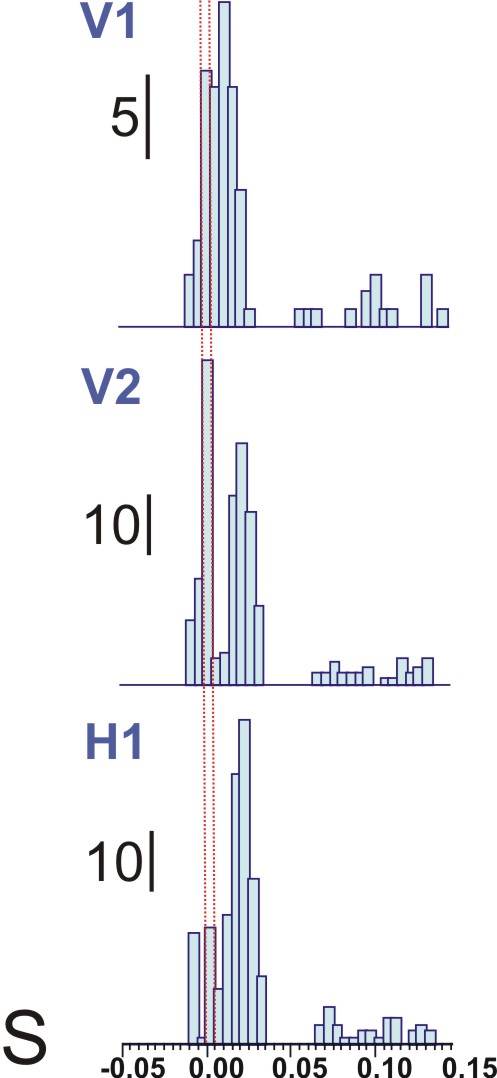
Figure 13 (below): Cross-correlograms produced by detecting action potentials in multi-unit recordings like those shown in Figure 12. On the left are cross-correlograms for spontaneous activity, between V1 and H1 (top), V1 and V2 (middle) and V2 and H1 (bottom). The red lines show time 0. A large peak at this position means a high degree of synchrony between the two recording sites. On the right are correlograms for evoked activity, triggered by the timing of the stimulus. The activity arrives later at H1 than at V2 or V1. This figure is from the work of Master's student, Patrick Wolfgang.
Figure 14 (below): Shows the effect of a drug that blocks electrical connections between inhibitory interneurons. Field potentials were recorded using the arrangement shown in Figure 9. The drug was applied for 65 minutes. This bar graph shows the measurement of the peak of the field negativity (representing excitatory activity in pyramidal neurons). The peak of the excitatory activity is increased in control tissue for both the superficial layer recording electrode (layers II/III, Sup), and the deep layer recording electrode (layer V). "Early Drug" shows the effect of the drug at 32-47 minutes after beginning application of the drug within the aCSF. "Late Drug" shows the effect at 62-77 minutes after beginning the application. The effect was significant at both time points. This drug did not change the peak of the field potential recorded in malformed cortex. Normally the electrical connections help to synchronize the activity of inhibitory interneurons, making their inhibition more powerful. This explains why relief of this synchronizing effect increases the excitatory field potential. Inhibitory interneurons may be less effective in malformed cortex because they lack this method of inhibitory synchronization. This graph is from the work of current sophomore undergraduate at VCU, Xuan Pham.
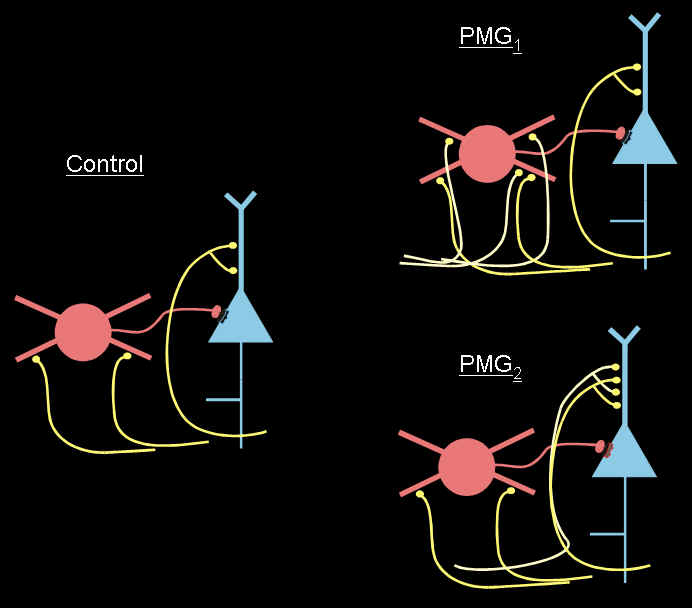
Figure 15 (below): Cartoon showing network connectivity changes in malformed (PMG) cortex. There is an increase in excitatory afferents to pyramidal neurons (blue) and to certain inhibitory cell subtypes (red).
Examples of human malformations can be found on the following web pages: http://www.hcs.harvard.edu/~husn/BRAIN/vol8-spring2001/schiz.htm http://www.path.sunysb.edu/faculty/woz/NPERESS/webclass7.htm http://www.bcm.edu/cain_foundation/noframes/html/pages/research/neuronal_migration_disorders_03.htm http://www.medscape.com/viewarticle/447789_2 http://www.neuropathologyweb.org/chapter11/chapter11dNMD.html http://www.northwestern.edu/nuin/fac/feng.htm http://www.lissencephaly.org/medical/info/update95/fig3.htm#Figure3a
|
This page is primarily intended for students
considering joining my lab.
If your child or someone you know has been diagnosed with epilepsy associated with a malformation, there are better web resources listed below. Please note this list is not comprehensive. Medical Information: Definitions: More General Epilepsy Information: Centers that Specialize in Malformations: Boston's Comprehensive Brain Malformation Program Massachusetts General Hospital University of Chicago Comprehensive Epilepsy Center Support Groups: Subcortical Band Heterotopia (Double Cortex Syndrome)
Other Malformation Research Sites" Rosen (studies dyslexia associated with malformations)
|
|
|