GETTING STARTED WITH DPGraph
These instructions are intended to help you familiarize yourself with the plotting software DPGraph. You should be sitting in front of a computer with DPGraph running in front of you.
Suppose you want to graph a particular surface, analyze some of its properties, and then print out your results for turning in. Consider the following simple problem.
Problem. Describe and sketch the surface: z = 4 - x^2. (the hat ^ indicates exponentiation; in this case, x squared)
Solution. Since the variable y is missing, this is a cylinder with rulings parallel to the y-axis. A graph of this cylinder is given below:
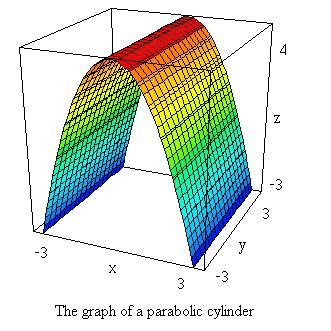
The cross section in the yz-plane is a parabola (also easy to see from the given equation), so we have a parabolic cylinder. Here is how you generate the above graph:
1. Download the surface-default graph by clicking its name, then click "Edit";
2. In the very last line of the Edit window, delete all the equations inside the "graph3d(...)" statement, and enter your own equation (in this case, the one given in the above problem);
3. Click "Execute" to get a color graph;
4. With the default domain -3 < x,y,z <3, you notice that the graph is cut off at the top. Increase the positive z value until the graph completes (here you should realize that the parabola's vertex is at z = 4, so just change the value of "graph3d.maximumz" from 3 to a number greater than or equal to 4). Now save your graph (on a floppy disk, if NOT using your own computer); click "Save as" then choose a directory (or the floppy drive), enter a name for your file and press "OK". The file will be saved with extension ".dpg".
5. Change the view by pressing down one of the "arrow" keys on your keyboard (this will rotate the graph) until you are satisfied that you have seen all aspects of the surface and have obtained the best view in your opinion.
EXPLORE! At this stage, with the graph in front of you, you can further analyze its various properties. Click edit and change the "Resolution" to a higher or a lower number to see the effect on the graph (generally, the higher the resolution, the smoother the graph). Then try slicing the graph up to see the "traces" of the surface by clicking "Scrollbar" then "Z slice". This give you one cross section orthogonal to the z-axis. Use the scrollbar at the far right of the screen to move this cross section up or down; do you understand what is happening and why? Next, click "Scrollbar" then "Y slice"; this time you see the unchanging parabolic cross section whose equation was given in the problem.
6. Go back to the ideal view you obtained earlier in step 5. You are ready to print your result as far as this problem is concerned. If you are not using a COLOR printer, then you must first turn you graph into black and white. This is easy; just click "Color" then "White". Then click "Clipboard" then "OK". Now to print out your graph, and possibly annotate it also, go back to the "software page" and follow the "printing with Paint" instructions.
Remark. The buttons "Help", "Clipboard", "Print" and "Animate" in DPGraph are for information. They should answer most, if not all, of your questions regarding operation with the software. Ask me if you still have a question; send e-mail or stop by my office.
The following useful facts are from the DPGraph help menu:
COMMON ERRORS: The seven most common mistakes when creating graphs
in the EDIT dialog box are: 1) leaving out asterisks for multiplication; 2)
leaving out equals signs or inequality signs; 3) leaving out the parentheses
for lists; 4) trying to use equalities in intersections (DPGraph
can only intersect inequalities, i.e. regions of space); 5) putting a space
inside the two-character symbols :=, >=, or <=; 6) using the parametric
variables u or v in implicit graphs; and 7) using the implicit variables x, y,
z, r, theta, rho, or phi in parametric graphs.
wrong: --- right:
graph3d( 3x = z^2 ) --- graph3d( 3*x = z^2 )
graph3d( x^2+y^2 ) --- graph3d( z = x^2+y^2 )
graph3d( x=1, y=1 ) --- graph3d( ( x=1, y=1 ) )
graph3d( x=1 & y=1 ) --- graph3d( x>1 & y>=1 )
graph3d( z^2> =x^2 ) --- graph3d( z^2 >= x^2 )
graph3d( z=u^2+v^2 ) --- graph3d( z=x^2+y^2 )
graph3d( rectangular(x,y,sin(x+y))
) --- graph3d( rectangular(u,v,sin(u+v)) )
INEQUALITIES: When graphing an inequality, such as GRAPH3D( X>1 ),
remember that "blue is true"; the bluest side of the graph is the
region of space for which the inequality is true, the reddest side of the graph
is the region of space for which the inequality is false. If the inequality is
true for the surface itself, as in GRAPH3D( X>=1 ),
then the bluest side is pure blue; if the inequality is false for the surface
itself, as in GRAPH3D( X>1 ), then the reddest side is pure red.
DEFAULTS.DPG: With experience you may find the following technique
useful when exploring a new surface. OPEN the file DEFAULTS.DPG, go to EDIT,
modify the default equation, and then EXECUTE. Since all of the options are
already in DEFAULTS.DPG they can be changed with very little typing. If you
like, SAVE the modified file under a different name and it will be ready for
future viewing and adjustments.
RESOLUTION: The easiest way to improve the appearance of some graphs
is to increase the resolution. The default resolution is 21 by 21 by 21 for
implicit graphs, and 40 by 40 for parametric surfaces. To change the resolution
for implicit graphs, use the EDIT dialog box to insert a line such as the
following before the GRAPH3D command:
graph3d.resolution := 30
For parametric surfaces:
graph3d.stepsu := 50
graph3d.stepsv := 50
You may find it useful to use the technique described in the previous section
on DEFAULTS.DPG.
COPYING A GRAPH TO THE CLIPBOARD: Click on CLIPBOARD to copy a picture
of the graph to the clipboard. To copy a picture of the entire window (including
the border, etc.) to the clipboard, simultaneously press down the ALT and
PRINTSCREEN keys. To copy a picture of the whole screen to the clipboard, press
PRINTSCREEN.
COPYING A GRAPH INTO ANOTHER APPLICATION: If the
other application supports pasting, first copy the graph to the clipboard.
Then click on EDIT in the other application, then click on PASTE.
PRINTING A GRAPH: First copy the the graph
to an application, such as Word or Paint, that supports printing. Then click on
FILE in the other application, then click on PRINT.
FILE FORMAT: DPGraph files have a file type
of .DPG. There are two kinds of DPG files: binary and ASCII. DPGraph can read and write either type of DPG file, but the
DPGraph Viewer can only read binary DPG files.
Binary DPG files are compressed and contain error detection information for
more reliable transmission. ASCII DPG files are readable and editable by
Notepad and many other text editors. Each line in the file is a separate
command for DPGraph. For example, a file might look
like this:
graph3d.view:=top
graph3d.perspective:=false
graph3d(z=3*sin(x*y))
Each command must be on a separate line. The GRAPH3D command must be on
the last line.