Vogel S, Hoke K, Elhai J (2001) Appendix: Simplified expressions of a measure of compositional bias. J Comp Biol 8:170-175.
Short DNA sequences are not equally likely and randomly disposed in our genomes -- if they were, we wouldn't be having this conversation. However, the degree of bias of short sequences (underrepresentation or overrepresentation with respect to chance) is not great in bacterial genomes. In E. coli (Figure 1), the bias of most 6-nucleotide sequences is confined to a narrow range centered around 1 (same frequency as chance). The story is different for a small fraction of these sequences, those that are palindromes. Palindromes are double-stranded sequences that read the same left-to-right (5' to 3') as right-to-left (5' to 3') and are often the target of proteins that bind DNA. Palindromic hexamers are decidedly biased towards underrepresentation.
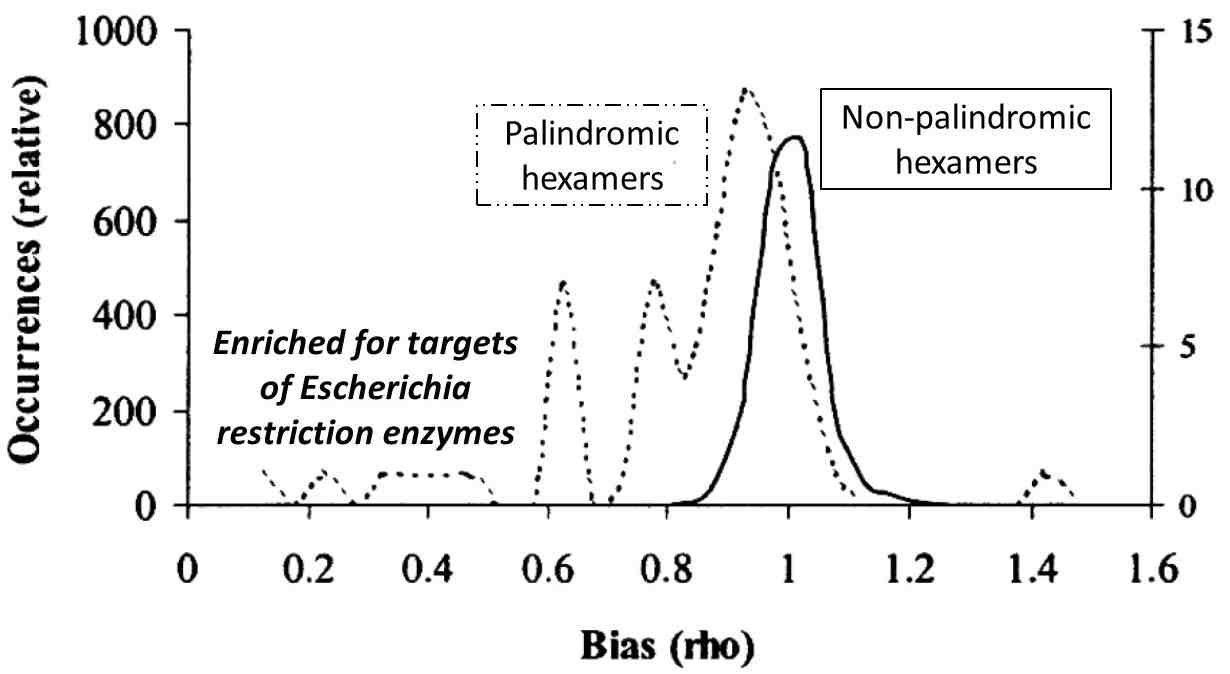
Figure 1. Bias in hexanucleotide sequences of Escherichia coli strain K12. Bias is computed as total compositional bias (explained in the text). The 64 possible palindromic hexanucleotide sequences are treated separately from the 4032 non-palindromic sequences. Bias values were binned every 0.05 units.
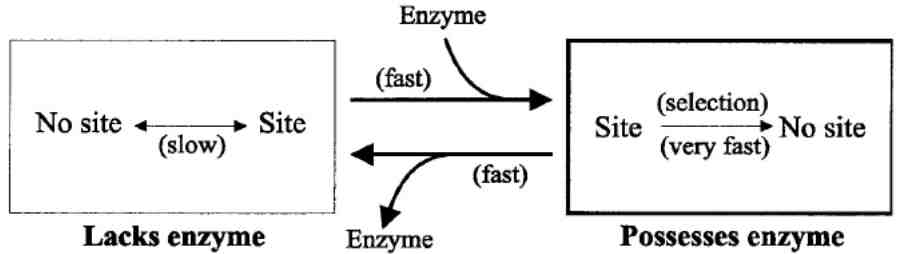
Figure 2. Model to explain underreprentation of targets for restriction enzymes in related strains.
Bias is computed as the ratio of actual frequency to expected frequency. The expected frequency of a sequence is generally calculated by one of two methods. The simpler method uses a Markov model and is based on three extreme sub-sequences. The more complext method, total compositional bias, takes into account all possible sub-sequences. Even though the calculations by these two methods are quite dissimilar, we showed that mathematically the Markov calculation is, surprisingly, equivalent to total compositional bias when gapped sequences contribute nothing to the bias (Figure 3).
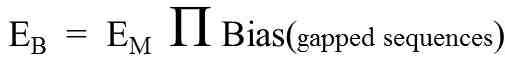
Figure 3. Relationship between methods of calculating bias. EB is the value calculated via total compositional bias. EM is the value calculated from a maximal Markov model. The rest of the equation is the product of all biases from gapped sequences.